Home Depot 2006 Annual Report Download - page 3
Download and view the complete annual report
Please find page 3 of the 2006 Home Depot annual report below. You can navigate through the pages in the report by either clicking on the pages listed below, or by using the keyword search tool below to find specific information within the annual report.-
 1
1 -
 2
2 -
 3
3 -
 4
4 -
 5
5 -
 6
6 -
 7
7 -
 8
8 -
 9
9 -
 10
10 -
 11
11 -
 12
12 -
 13
13 -
 14
14 -
15
-
16
-
17
-
18
-
19
-
20
-
21
-
22
-
23
-
24
-
25
-
26
-
27
-
28
-
29
-
30
-
31
-
32
-
33
-
34
-
35
-
36
-
37
-
38
-
39
-
40
-
41
-
42
-
43
-
44
-
45
-
46
-
47
-
48
-
49
-
50
-
51
-
52
-
53
-
54
-
55
-
56
-
57
-
58
-
59
-
60
-
61
-
62
-
63
-
64
-
65
-
66
-
67
-
68
-
69
-
70
-
71
-
72
-
73
-
74
-
75
-
76
-
77
-
78
-
79
-
80
-
81
-
82
-
83
-
84
 |
 |

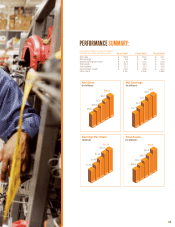
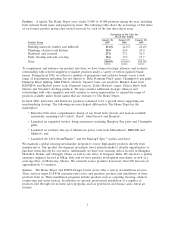
Net Sales
(in billions)
Earnings Per Share
(diluted)
Total Assets
(in billions)
Net Earnings
(in billions)
$58.2
$64.8
$73.1
$81.5
$90.8
$3.7
$4.3
$5.0
$5.8
$5.8
$1.56
$1.88
$2.26
$2.72
$2.79
$30.0
$34.4
$39.0
$44.4
$52.3
PERFORMANCE SUMMARY:
Net sales
Net earnings
Diluted earnings per share
Total assets
Total liabilities
Stockholders’ equity
Store count
$
$
$
$
$
$
90.8
5.8
2.79
52.3
27.2
25.0
2,147
Fiscal 2006
$
$
$
$
$
$
81.5
5.8
2.72
44.4
17.5
26.9
2,042
Fiscal 2005
$
$
$
$
$
$
73.1
5.0
2.26
39.0
14.9
24.2
1,890
Fiscal 2004
(amounts in billions, except for diluted
earnings per share and store count)
A3