Home Depot 2006 Annual Report Download - page 34
Download and view the complete annual report
Please find page 34 of the 2006 Home Depot annual report below. You can navigate through the pages in the report by either clicking on the pages listed below, or by using the keyword search tool below to find specific information within the annual report.-
 1
1 -
2
-
3
-
4
-
5
-
6
-
7
-
8
-
9
-
10
-
11
-
12
-
13
-
14
-
15
-
16
-
17
-
18
-
19
-
20
-
21
-
22
-
23
-
 24
24 -
 25
25 -
 26
26 -
 27
27 -
 28
28 -
 29
29 -
 30
30 -
 31
31 -
 32
32 -
 33
33 -
 34
34 -
 35
35 -
 36
36 -
 37
37 -
 38
38 -
 39
39 -
 40
40 -
 41
41 -
 42
42 -
 43
43 -
 44
44 -
45
-
46
-
47
-
48
-
49
-
50
-
51
-
52
-
53
-
54
-
55
-
56
-
57
-
58
-
59
-
60
-
61
-
62
-
63
-
64
-
65
-
66
-
67
-
68
-
69
-
70
-
71
-
72
-
73
-
74
-
75
-
76
-
77
-
78
-
79
-
80
-
81
-
82
-
83
-
84
 |
 |
Interest, net
In fiscal 2006, we recognized $365 million of net Interest Expense compared to $81 million in fiscal
2005. Net Interest Expense as a percent of Net Sales was 0.4% for fiscal 2006 compared to 0.1% for
fiscal 2005. The increase was primarily due to additional interest incurred related to the March 2006
issuance of $1.0 billion of 5.20% Senior Notes and $3.0 billion of 5.40% Senior Notes and the
December 2006 issuance of $750 million of floating rate Senior Notes, $1.25 billion of 5.25% Senior
Notes and $3.0 billion of 5.875% Senior Notes.
Provision for Income Taxes
Our combined federal, state and foreign effective income tax rate increased to 38.1% for fiscal 2006
from 37.1% for fiscal 2005. The increase in our effective income tax rate for fiscal 2006 was primarily
due to the impact of a retroactive tax assessment from the Canadian province of Quebec. During the
second quarter of fiscal 2006, the Quebec National Assembly passed legislation that retroactively
changed certain tax laws that subjected us to additional tax and interest. As a result, we received an
assessment from Quebec for $57 million in retroactive tax and $12 million in related interest for the
2002 through 2005 taxable years.
Diluted Earnings per Share
Diluted Earnings per Share were $2.79 for fiscal 2006 and $2.72 for fiscal 2005. Diluted Earnings per
Share were favorably impacted in both fiscal 2006 and fiscal 2005 by the repurchase of shares of our
common stock under our $17.5 billion repurchase authorization. Since the inception of the program in
2002, we have repurchased 451 million shares of our common stock for a total of $16.4 billion,
including $5 billion through accelerated share repurchases in fiscal 2006. As of January 28, 2007, we
had $1.1 billion remaining under our authorized share repurchase program.
Fiscal 2005 Compared to Fiscal Year Ended January 30, 2005 (‘‘fiscal 2004’’)
Net Sales
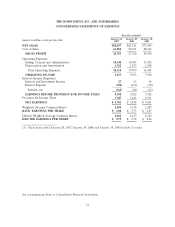
Net Sales for fiscal 2005 increased 11.5% to $81.5 billion from $73.1 billion for fiscal 2004. Fiscal 2005
Net Sales growth was driven by an increase in retail comparable store sales of 3.1%, sales from new
stores opened during fiscal 2005 and fiscal 2004 and sales from our newly acquired businesses within
HD Supply.
The increase in retail comparable store sales in fiscal 2005 reflects a number of factors. Our average
ticket, which increased 5.6% to $57.98, increased in all selling departments and our retail comparable
store sales growth in fiscal 2005 was positive in 9 of 10 selling departments. Building materials had the
strongest retail comparable store sales increase through sales growth of gypsum, roofing, concrete and
insulation, due in part to the impact of one of the most destructive hurricane seasons in modern U.S.
history. We experienced strong retail comparable store sales growth in kitchen and bath driven by
continued growth in appliances and kitchen installations. We also experienced strong retail comparable
store sales in our Pro categories, including plumbing, electrical and hardware in fiscal 2005. The impact
of cannibalization partially offset our fiscal 2005 retail comparable store sales growth. As of the end of
fiscal 2005, certain new stores cannibalized approximately 20% of our existing stores and we estimate
that store cannibalization reduced fiscal 2005 retail comparable store sales by approximately 1.8%.
The growth in Net Sales for fiscal 2005 also reflects growth in services revenue, which increased 16.6%
to $3.5 billion for fiscal 2005 from $3.0 billion for fiscal 2004. The growth in services revenue was
driven by strength in a number of areas including countertops, roofing, kitchens, windows and HVAC.
24