Home Depot 2006 Annual Report Download - page 46
Download and view the complete annual report
Please find page 46 of the 2006 Home Depot annual report below. You can navigate through the pages in the report by either clicking on the pages listed below, or by using the keyword search tool below to find specific information within the annual report.-
 1
1 -
2
-
3
-
4
-
5
-
6
-
7
-
8
-
9
-
10
-
11
-
12
-
13
-
14
-
15
-
16
-
17
-
18
-
19
-
20
-
21
-
22
-
23
-
24
-
25
-
26
-
27
-
28
-
29
-
30
-
31
-
32
-
33
-
34
-
35
-
 36
36 -
 37
37 -
 38
38 -
 39
39 -
 40
40 -
 41
41 -
 42
42 -
 43
43 -
 44
44 -
 45
45 -
 46
46 -
 47
47 -
 48
48 -
 49
49 -
 50
50 -
 51
51 -
 52
52 -
 53
53 -
 54
54 -
 55
55 -
 56
56 -
57
-
58
-
59
-
60
-
61
-
62
-
63
-
64
-
65
-
66
-
67
-
68
-
69
-
70
-
71
-
72
-
73
-
74
-
75
-
76
-
77
-
78
-
79
-
80
-
81
-
82
-
83
-
84
 |
 |

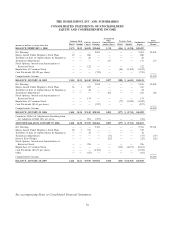
THE HOME DEPOT, INC. AND SUBSIDIARIES
CONSOLIDATED STATEMENTS OF STOCKHOLDERS’
EQUITY AND COMPREHENSIVE INCOME
Accumulated
Other Total
Common Stock Treasury Stock
Paid-In Retained Comprehensive Stockholders’ Comprehensive
Shares Amount Capital Earnings Income (Loss) Shares Amount Equity Income
amounts in millions, except per share data
BALANCE, FEBRUARY 1, 2004 2,373 $119 $6,108 $19,680 $ 90 (116) $ (3,590) $22,407
Net Earnings — — — 5,001 — — — 5,001 $5,001
Shares Issued Under Employee Stock Plans 12 — 286 — — — — 286
Tax Effect of Sale of Option Shares by Employees — — 26 — — — — 26
Translation Adjustments — — — — 137 — — 137 137
Stock Options, Awards and Amortization of
Restricted Stock — — 122 — — — — 122
Repurchase of Common Stock — — — — — (84) (3,102) (3,102)
Cash Dividends ($0.325 per share) — — — (719) — — — (719)
Comprehensive Income $5,138
BALANCE, JANUARY 30, 2005 2,385 $119 $6,542 $23,962 $227 (200) $ (6,692) $24,158
Net Earnings — — — 5,838 — — — 5,838 $5,838
Shares Issued Under Employee Stock Plans 16 1 409 — — — — 410
Tax Effect of Sale of Option Shares by Employees — — 24 — — — — 24
Translation Adjustments — — — — 182 — — 182 182
Stock Options, Awards and Amortization of
Restricted Stock — — 174 — — — — 174
Repurchase of Common Stock — — — — — (77) (3,020) (3,020)
Cash Dividends ($0.40 per share) — — — (857) — — — (857)
Comprehensive Income $6,020
BALANCE, JANUARY 29, 2006 2,401 $120 $7,149 $28,943 $409 (277) $ (9,712) $26,909
Cumulative Effect of Adjustments Resulting from
the Adoption of SAB 108, net of tax — — 201 (257) — — — (56)
ADJUSTED BALANCE, JANUARY 29, 2006 2,401 $120 $7,350 $28,686 $409 (277) $ (9,712) $26,853
Net Earnings — — — 5,761 — — — 5,761 $5,761
Shares Issued Under Employee Stock Plans 20 1 351 — — — — 352
Tax Effect of Sale of Option Shares by Employees — — 18 — — — — 18
Translation Adjustments — — — — (77) — — (77) (77)
Interest Rate Hedges — — — — (22) — — (22) (22)
Stock Options, Awards and Amortization of
Restricted Stock — — 296 — — — — 296
Repurchase of Common Stock — — — — — (174) (6,671) (6,671)
Cash Dividends ($0.675 per share) — — — (1,395) — — — (1,395)
Other — — (85) — — — — (85)
Comprehensive Income $5,662
BALANCE, JANUARY 28, 2007 2,421 $121 $7,930 $33,052 $310 (451) $(16,383) $25,030
See accompanying Notes to Consolidated Financial Statements.
36