Home Depot 2006 Annual Report Download - page 30
Download and view the complete annual report
Please find page 30 of the 2006 Home Depot annual report below. You can navigate through the pages in the report by either clicking on the pages listed below, or by using the keyword search tool below to find specific information within the annual report.-
 1
1 -
2
-
3
-
4
-
5
-
6
-
7
-
8
-
9
-
10
-
11
-
12
-
13
-
14
-
15
-
16
-
17
-
18
-
19
-
 20
20 -
 21
21 -
 22
22 -
 23
23 -
 24
24 -
 25
25 -
 26
26 -
 27
27 -
 28
28 -
 29
29 -
 30
30 -
 31
31 -
 32
32 -
 33
33 -
 34
34 -
 35
35 -
 36
36 -
 37
37 -
 38
38 -
 39
39 -
 40
40 -
41
-
42
-
43
-
44
-
45
-
46
-
47
-
48
-
49
-
50
-
51
-
52
-
53
-
54
-
55
-
56
-
57
-
58
-
59
-
60
-
61
-
62
-
63
-
64
-
65
-
66
-
67
-
68
-
69
-
70
-
71
-
72
-
73
-
74
-
75
-
76
-
77
-
78
-
79
-
80
-
81
-
82
-
83
-
84
 |
 |

Item 7. Management’s Discussion and Analysis of Financial Condition and Results of Operations.
Executive Summary and Selected Consolidated Statements of Earnings Data
For fiscal year ended January 28, 2007 (‘‘fiscal 2006’’), we reported Net Earnings of $5.8 billion and
Diluted Earnings per Share of $2.79 compared to Net Earnings of $5.8 billion and Diluted Earnings
per Share of $2.72 for fiscal year ended January 29, 2006 (‘‘fiscal 2005’’). Net Sales increased 11.4% to
$90.8 billion for fiscal 2006 from $81.5 billion for fiscal 2005. Our gross profit margin was 32.8% and
our operating margin was 10.7% for fiscal 2006.
In the face of a slowdown in the housing market, our retail comparable store sales declined 2.8% in
fiscal 2006 driven by a decline in comparable store customer transactions. This was partially offset by
an increase in our average ticket of 1.6% in fiscal 2006 to $58.90, including increases in 8 of 10 selling
departments.
We grew our numerous installation and home maintenance programs serving our do-it-for-me
customers through our stores. Our retail services revenue increased 8.3% to $3.8 billion for fiscal 2006.
We experienced sustained growth in categories such as countertops, exterior patios, solar, windows and
HVAC.
We continued to introduce innovative and distinctive merchandise that reflects emerging consumer
trends, supported by continued investments in store modernization and technology. We invested
$3.5 billion in capital expenditures during fiscal 2006 primarily for new store construction, store
modernization and technology. We began an accelerated store reinvestment program whereby we
increased our investment in existing stores by $350 million more than our plan in the second half of
fiscal 2006 to enhance the customer experience. This investment included capital and expense dollars to
reset 100 merchandise bays in 540 stores, incorporate a richer staffing model and support our ‘‘Orange
Juiced’’ program, a customer service incentive program for our store associates.
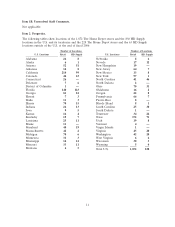
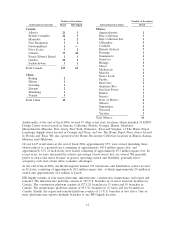
We added 125 new stores in fiscal 2006, including 12 stores through our acquisition of The Home Way,
a Chinese home improvement retailer, and 10 relocations, bringing our total store count at the end of
fiscal 2006 to 2,147. As of the end of fiscal 2006, 228, or approximately 11%, of our stores were located
in Canada, Mexico or China compared to 191, or approximately 9%, at the end of fiscal 2005.
We have expanded our business by capturing a growing share of the professional residential,
commercial and heavy construction markets through the growth of HD Supply. HD Supply experienced
162% Net Sales growth in fiscal 2006 and accounted for approximately 13% of our total Net Sales in
fiscal 2006. We completed 12 acquisitions in fiscal 2006 that were integrated into HD Supply, including
Hughes Supply, Inc., a leading distributor of construction and repair products. Organic Net Sales
growth for the HD Supply segment was 5.6% in fiscal 2006.
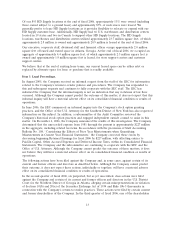
In February 2007, we announced our decision to evaluate strategic alternatives for HD Supply. In order
to maximize the value of HD Supply, we would need to further integrate it with our Retail business.
We are currently evaluating whether this integration or other strategic alternatives, such as a sale or
initial public offering of the business, would create the most shareholder value.
We generated $7.7 billion of cash flow from operations in fiscal 2006. We used this cash flow, along
with the net proceeds of additional borrowings of $7.6 billion, to fund $8.1 billion of share repurchases
and dividends, $4.3 billion in acquisitions and $3.5 billion in capital expenditures. At the end of fiscal
2006, our long-term debt-to-equity ratio was 47%. Our return on invested capital (computed on
beginning long-term debt and equity for the trailing four quarters) was 20.5% at the end of fiscal 2006
compared to 22.4% for fiscal 2005.
20