Home Depot 2006 Annual Report Download - page 68
Download and view the complete annual report
Please find page 68 of the 2006 Home Depot annual report below. You can navigate through the pages in the report by either clicking on the pages listed below, or by using the keyword search tool below to find specific information within the annual report.-
 1
1 -
2
-
3
-
4
-
5
-
6
-
7
-
8
-
9
-
10
-
11
-
12
-
13
-
14
-
15
-
16
-
17
-
18
-
19
-
20
-
21
-
22
-
23
-
24
-
25
-
26
-
27
-
28
-
29
-
30
-
31
-
32
-
33
-
34
-
35
-
36
-
37
-
38
-
39
-
40
-
41
-
42
-
43
-
44
-
45
-
46
-
47
-
48
-
49
-
50
-
51
-
52
-
53
-
54
-
55
-
56
-
57
-
 58
58 -
 59
59 -
 60
60 -
 61
61 -
 62
62 -
 63
63 -
 64
64 -
 65
65 -
 66
66 -
 67
67 -
 68
68 -
 69
69 -
 70
70 -
 71
71 -
 72
72 -
 73
73 -
 74
74 -
 75
75 -
 76
76 -
 77
77 -
 78
78 -
79
-
80
-
81
-
82
-
83
-
84
 |
 |

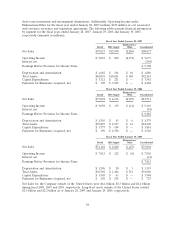
short-term investments and intersegment eliminations. Additionally, Operating Income under
Eliminations/Other for the fiscal year ended January 28, 2007 includes $129 million of cost associated
with executive severance and separation agreements. The following tables present financial information
by segment for the fiscal years ended January 28, 2007, January 29, 2006 and January 30, 2005,
respectively (amounts in millions):
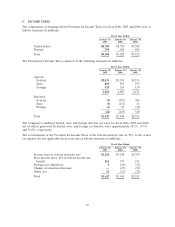
Fiscal Year Ended January 28, 2007
Eliminations/
Retail HD Supply Other Consolidated
Net Sales $79,027 $12,070 $(260) $90,837
Operating Income $ 9,024 $ 800 $(151) $ 9,673
Interest, net (365)
Earnings Before Provision for Income Taxes $ 9,308
Depreciation and Amortization $ 1,682 $ 194 $ 10 $ 1,886
Total Assets $42,094 $10,021 $ 148 $52,263
Capital Expenditures $ 3,321 $ 221 $ — $ 3,542
Payments for Businesses Acquired, net $ 305 $ 3,963 $ — $ 4,268
Fiscal Year Ended January 29, 2006
Eliminations/
Retail HD Supply Other Consolidated
Net Sales $77,022 $ 4,614 $(125) $81,511
Operating Income $ 9,058 $ 319 $ (14) $ 9,363
Interest, net (81)
Earnings Before Provision for Income Taxes $ 9,282
Depreciation and Amortization $ 1,510 $ 63 $ 6 $ 1,579
Total Assets $39,827 $ 4,517 $ 61 $44,405
Capital Expenditures $ 3,777 $ 104 $ — $ 3,881
Payments for Businesses Acquired, net $ 190 $ 2,356 $ — $ 2,546
Fiscal Year Ended January 30, 2005
Eliminations/
Retail HD Supply Other Consolidated
Net Sales $71,101 $ 2,040 $ (47) $73,094
Operating Income $ 7,812 $ 122 $ (8) $ 7,926
Interest, net (14)
Earnings Before Provision for Income Taxes $ 7,912
Depreciation and Amortization $ 1,296 $ 20 $ 3 $ 1,319
Total Assets $36,902 $ 1,406 $ 712 $39,020
Capital Expenditures $ 3,905 $ 43 $ — $ 3,948
Payments for Businesses Acquired, net $ 202 $ 525 $ — $ 727
Net Sales for the Company outside of the United States were $6.4 billion, $5.3 billion and $4.2 billion
during fiscal 2006, 2005 and 2004, respectively. Long-lived assets outside of the United States totaled
$2.5 billion and $2.2 billion as of January 28, 2007 and January 29, 2006, respectively.
58