Home Depot 2006 Annual Report Download - page 33
Download and view the complete annual report
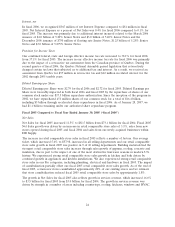
Please find page 33 of the 2006 Home Depot annual report below. You can navigate through the pages in the report by either clicking on the pages listed below, or by using the keyword search tool below to find specific information within the annual report.Net Sales for our HD Supply segment for fiscal 2006 were $12.1 billion, an increase of 162% over fiscal
2005. The increase was primarily a result of recent acquisitions. Organic Net Sales growth for the HD
Supply segment was 5.6% in fiscal 2006, which includes the impact of commodity price inflation and
market share gains.
We believe that our sales performance has been, and could continue to be, negatively impacted by the
level of competition that we encounter in various markets. Due to the highly-fragmented U.S. home
improvement and professional supply industry, in which we estimate our market share is approximately
10%, measuring the impact on our sales by our competitors is difficult.
Gross Profit
Total Gross Profit increased 9.0% to $29.8 billion for fiscal 2006 from $27.3 billion for fiscal 2005.
Gross Profit as a percent of Net Sales decreased 73 basis points to 32.8% for fiscal 2006 compared to
33.5% for fiscal 2005. The decline in total Gross Profit as a percent of Net Sales was primarily due to a
higher penetration of the lower margin HD Supply segment. In fiscal 2006, 65 basis points of the total
Gross Profit decline was a result of a higher penetration of HD Supply businesses as well as a drop in
HD Supply’s Gross Profit rate due to a change in the mix of businesses owned.
Operating Expenses
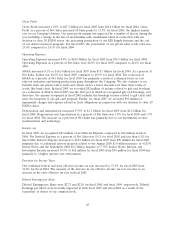
Operating Expenses increased 12.0% to $20.1 billion for fiscal 2006 from $18.0 billion for fiscal 2005.
Operating Expenses as a percent of Net Sales were 22.1% for fiscal 2006 compared to 22.0% for fiscal
2005.
Selling, General and Administrative Expenses (‘‘SG&A’’) increased 11.3% to $18.3 billion for fiscal
2006 from $16.5 billion for fiscal 2005. As a percent of Net Sales, SG&A was 20.2% for fiscal 2006 and
fiscal 2005. The increase in SG&A during fiscal 2006 was due to added associate labor hours on the
floor of our stores, increased spending on store maintenance programs and the expansion of
merchandise display resets. This increase was partially offset by reduced self-insurance costs as we
continue to realize benefits from safety programs and other initiatives. Fiscal 2006 SG&A also reflects
benefits from our private label credit card, which carries a lower discount rate than other forms of
credit, like bank cards. Through our private label credit card we offer no interest/no payment programs.
The cost of deferred interest associated with these programs is included in Cost of Sales. We believe
these programs deliver long-term benefits, including higher average ticket and customer loyalty. For
fiscal 2006, the penetration of our private label credit sales was 28.0% compared to 25.6% for fiscal
2005.
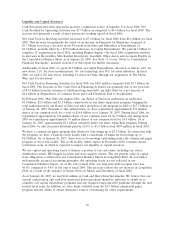
Also impacting our SG&A in fiscal 2006 is expense associated with executive severance of $129 million
and the adoption of Statement of Financial Accounting Standards (‘‘SFAS’’) No. 123(R), ‘‘Share-Based
Payment’’ (‘‘SFAS 123(R)’’), whereby we recorded approximately $40 million of stock compensation
expense related to the continued vesting of options granted prior to fiscal 2003. Partially offsetting the
increase in SG&A was $91 million of impairment charges and expense related to lease obligations
associated with the closing of 20 EXPO stores in fiscal 2005.
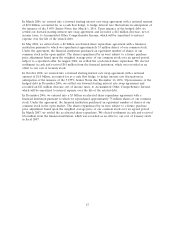
Depreciation and Amortization increased 19.7% to $1.8 billion for fiscal 2006 from $1.5 billion for
fiscal 2005. Depreciation and Amortization as a percent of Net Sales was 1.9% for fiscal 2006 and 1.8%
for fiscal 2005. The increase as a percent of Net Sales was primarily due to the amortization of
intangible assets acquired as part of our recent acquisitions and the depreciation of our investments in
store modernization and technology.
23


