Home Depot 2004 Annual Report Download - page 45
Download and view the complete annual report
Please find page 45 of the 2004 Home Depot annual report below. You can navigate through the pages in the report by either clicking on the pages listed below, or by using the keyword search tool below to find specific information within the annual report.-
 1
1 -
2
-
3
-
4
-
5
-
6
-
7
-
8
-
9
-
10
-
11
-
12
-
13
-
14
-
15
-
16
-
17
-
18
-
19
-
20
-
21
-
22
-
23
-
24
-
25
-
26
-
27
-
28
-
29
-
30
-
31
-
32
-
33
-
34
-
 35
35 -
 36
36 -
 37
37 -
 38
38 -
 39
39 -
 40
40 -
 41
41 -
 42
42 -
 43
43 -
 44
44 -
 45
45 -
 46
46 -
 47
47 -
 48
48
 |
 |

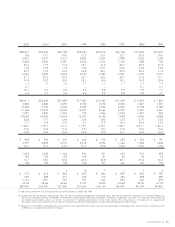
43The Home Depot, Inc.
2002 2001
(1)
2000 1999 1998 1997 1996
(1)
1995
$58,247 $53,553 $45,738 $38,434 $30,219 $24,156 $19,535 $15,470
8.8 17.1 19.0 27.2 25.1 23.7 26.3 24.0
5,872 4,957 4,217 3,804 2,654 1,898 1,535 1,195
3,664 3,044 2,581 2,320 1,614 1,160 938 732
20.4 17.9 11.3 43.7 31.9 23.7 28.2 21.0
1.56 1.29 1.10 1.00 0.71 0.52 0.43 0.34
20.9 17.3 10.0 40.8 29.1 20.9 26.5 17.2
2,344 2,353 2,352 2,342 2,320 2,287 2,195 2,151
31.1 30.2 29.9 29.7 28.5 28.1 27.8 27.7
19.4 19.2 18.9 18.1 18.0 18.1 18.3 18.4
1.7 1.7 1.8 1.7 1.7 1.7 1.7 1.7
0.1 – – – – – 0.1 0.1
10.1 9.3 9.2 9.9 8.8 7.9 7.9 7.7
6.3 5.7 5.6 6.0 5.3 4.8 4.8 4.7
$30,011 $26,394 $21,385 $17,081 $13,465 $11,229 $ 9,342 $ 7,354
3,882 3,860 3,392 2,734 2,076 2,004 1,867 1,255
8,338 6,725 6,556 5,489 4,293 3,602 2,708 2,180
17,168 15,375 13,068 10,227 8,160 6,509 5,437 4,461
1,321 1,250 1,545 750 1,566 1,303 1,247 720
19,802 18,082 15,004 12,341 8,740 7,098 5,955 4,988
8.38 7.71 6.46 5.36 3.95 3.23 2.75 2.32
6.7 6.9 10.3 6.1 17.9 18.4 20.9 14.4
1.48:1 1.59:1 1.77:1 1.75:1 1.73:1 1.82:1 2.01:1 1.89:1
5.3x 5.4x 5.1x 5.4x 5.4x 5.4x 5.6x 5.5x
18.8 18.3 19.6 22.5 19.3 16.1 16.3 16.3
$903 $ 764 $ 601 $ 463 $ 373 $ 283 $ 232 $ 181
2,749 3,393 3,574 2,618 2,094 1,464 1,248 1,308
0.21 0.17 0.16 0.11 0.08 0.06 0.05 0.04
1,532 1,333 1,134 930 761 624 512 423
166 146 123 100 81 66 54 44
14.1 18.5 22.6 23.5 22.8 23.1 21.6 26.3
108 109 108 108 107 106 105 105
––4107773
$ 772 $ 812 $ 864 $ 876 $ 844 $ 829 $ 803 $ 787
370 388 415 423 410 406 398 390
1,161 1,091 937 797 665 550 464 370
49.43 48.64 48.65 47.87 45.05 43.63 42.09 41.78
280,900 256,300 227,300 201,400 156,700 124,400 98,100 80,800
(5) Adjusted to reflect the first 52 weeks of the 53-week fiscal years in 2001 and 1996.
(6) Includes net sales at locations open greater than 12 months, including relocated and remodeled stores, and net sales of all the subsidiaries of The Home Depot, Inc.
Stores and subsidiaries become comparable on the Monday following their 365th day of operation. We believe comparable store sales is a meaningful measurement of
our operating performance and is a common measurement of operating performance in the retail industry. This measurement is intended only as supplemental
information, and is not a substitute for net sales or net earnings presented in accordance with generally accepted accounting principles.
(7) Beginning in fiscal 2003, comparable store sales increases were reported to the nearest one-tenth of a percentage. Comparable store sales increases in fiscal years prior
to 2003 were not adjusted to reflect this change.