Home Depot 2004 Annual Report Download - page 22
Download and view the complete annual report
Please find page 22 of the 2004 Home Depot annual report below. You can navigate through the pages in the report by either clicking on the pages listed below, or by using the keyword search tool below to find specific information within the annual report.
Management’s Discussion and Analysis of
Results of Operations and Financial Condition (continued)
The Home Depot, Inc. and Subsidiaries
20
LIQUIDITY AND CAPITAL RESOURCES
Cash flow generated from operations provides us with a significant
source of liquidity. For fiscal 2004, Net Cash Provided by
Operating Activities increased to $6.9 billion from $6.5 billion
for fiscal 2003. This increase was primarily driven by stronger
Net Earnings and an increase in non-cash charges, such as depre-
ciation and amortization.
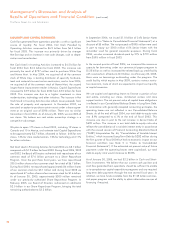
Net Cash Used in Investing Activities increased to $4.5 billion for
fiscal 2004 from $4.2 billion for fiscal 2003. This increase was
primarily the result of $727 million used to purchase White Cap
and Home Mart. In May 2004, we acquired all of the common
stock of White Cap, a leading distributor of specialty hardware,
tools and materials to construction contractors, and in June 2004,
we acquired all of the common stock of Home Mart, the second
largest home improvement retailer in Mexico. Capital Expenditures
increased to $3.9 billion for fiscal 2004 from $3.5 billion for fiscal
2003. This increase was due to a higher investment in store
modernization, technology and other initiatives. The increase in Net
Cash Used in Investing Activities also reflects lower proceeds from
the sale of property and equipment. In December 2003, we
exercised an option to purchase certain assets under a lease agree-
ment at an original cost of $598 million. There was no similar
transaction in fiscal 2004. As of January 30, 2005, we own 86% of
our stores. We believe our real estate ownership strategy is a
competitive advantage.
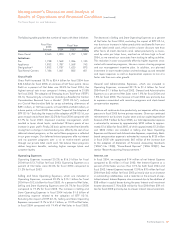
We plan to open 175 stores in fiscal 2005, including 19 stores in
Canada and 10 in Mexico, and estimate total Capital Expenditures
to be approximately $3.7 billion, allocated as follows: 64% for new
stores, 13% for store modernization, 12% for technology and 11%
for other initiatives.
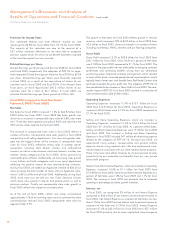
Net Cash Used in Financing Activities for fiscal 2004 was $3.1 billion
compared with $1.9 billion for fiscal 2003. During fiscal 2004, 2003
and 2002, the Board of Directors authorized total repurchases of our
common stock of $7.0 billion pursuant to a Share Repurchase
Program. Over the past three fiscal years, we have repurchased
200.5 million shares of our common stock for a total of $6.7 billion.
During fiscal 2004, we repurchased approximately 84 million shares
of our common stock for $3.1 billion and during fiscal 2003 we
repurchased 47 million shares of our common stock for $1.6 billion.
As of January 30, 2005, approximately $300 million remained
under our previously authorized Share Repurchase Program. In
February 2005, our Board of Directors authorized an additional
$2.0 billion in our Share Repurchase Program, bringing the total
remaining authorization to $2.3 billion.
In September 2004, we issued $1.0 billion of 33⁄4% Senior Notes
(see Note 2 in “Notes to Consolidated Financial Statements”) at a
discount of $5 million. The net proceeds of $995 million were used
in part to repay our $500 million 61⁄2% Senior Notes with the
remainder used for general corporate purposes. During fiscal
2004, we also increased dividends paid by 21% to $719 million
from $595 million in fiscal 2003.
In the second quarter of fiscal 2004, we increased the maximum
capacity for borrowing under our commercial paper program to
$1.25 billion as well as increased the related back-up credit facility
with a consortium of banks to $1.0 billion. As of January 30, 2005,
there were no borrowings outstanding under the program. The
credit facility, which expires in May 2009, contains various restric-
tive covenants, none of which are expected to impact our liquidity
or capital resources.
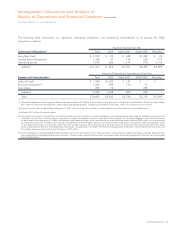
We use capital and operating leases to finance a portion of our
real estate, including our stores, distribution centers and store
support centers. The net present value of capital lease obligations
is reflected in our Consolidated Balance Sheets in Long-Term Debt.
In accordance with generally accepted accounting principles, the
operating leases are not reflected in our Consolidated Balance
Sheets. As of the end of fiscal 2004, our total debt-to-equity ratio
was 8.9% compared to 6.1% at the end of fiscal 2003. This
increase was due in part to the net increase in Senior Notes of
$495 million. The increase in our total debt-to-equity ratio also
reflects the consolidation of a variable interest entity in accordance
with the revised version of Financial Accounting Standards Board
(“FASB”) Interpretation No. 46, “Consolidation of Variable Interest
Entities,” which increased Long-Term Debt by $282 million during
the first quarter of fiscal 2004 but had no economic impact on our
financial condition (see Note 5 in “Notes to Consolidated
Financial Statements”). If the estimated net present value of future
payments under the operating leases were capitalized, our total
debt-to-equity ratio would increase to 30.8%.
As of January 30, 2005, we had $2.2 billion in Cash and Short-
Term Investments. We believe that our current cash position and
cash flow generated from operations should be sufficient to enable
us to complete our capital expenditure programs and any required
long-term debt payments through the next several fiscal years. In
addition, we have funds available from the $1.25 billion commer-
cial paper program and the ability to obtain alternative sources of
financing if required.


