Home Depot 2004 Annual Report Download - page 29
Download and view the complete annual report
Please find page 29 of the 2004 Home Depot annual report below. You can navigate through the pages in the report by either clicking on the pages listed below, or by using the keyword search tool below to find specific information within the annual report.-
 1
1 -
2
-
3
-
4
-
5
-
6
-
7
-
8
-
9
-
10
-
11
-
12
-
13
-
14
-
15
-
16
-
17
-
18
-
 19
19 -
 20
20 -
 21
21 -
 22
22 -
 23
23 -
 24
24 -
 25
25 -
 26
26 -
 27
27 -
 28
28 -
 29
29 -
 30
30 -
 31
31 -
 32
32 -
 33
33 -
 34
34 -
 35
35 -
 36
36 -
 37
37 -
 38
38 -
 39
39 -
40
-
41
-
42
-
43
-
44
-
45
-
46
-
47
-
48
 |
 |

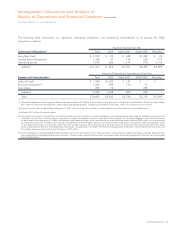
Consolidated Statements of Cash Flows
The Home Depot, Inc. and Subsidiaries
27The Home Depot, Inc.
Fiscal Year Ended
(1)
January 30, February 1, February 2,
amounts in millions
2005 2004 2003
CASH FLOWS FROM OPERATING ACTIVITIES:
Net Earnings $ 5,001 $ 4,304 $ 3,664
Reconciliation of Net Earnings to Net Cash Provided by Operating Activities:
Depreciation and Amortization 1,319 1,076 903
Stock-Based Compensation Expense 125 67 15
Changes in Assets and Liabilities, net of the effects of acquisitions:
(Increase) Decrease in Receivables, net (266) 25 (38)
Increase in Merchandise Inventories (849) (693) (1,592)
Increase in Accounts Payable and Accrued Liabilities 917 790 1,394
Increase in Deferred Revenue 263 279 147
Increase (Decrease) in Income Taxes Payable 2(27) 83
Increase in Deferred Income Taxes 319 605 173
Increase in Other Long-Term Liabilities 119 33 66
Other (46) 86 (13)
Net Cash Provided by Operating Activities 6,904 6,545 4,802
CASH FLOWS FROM INVESTING ACTIVITIES:
Capital Expenditures, net of $38, $47 and $49 of non-cash capital
expenditures in fiscal 2004, 2003 and 2002, respectively (3,948) (3,508) (2,749)
Purchase of Assets from Off-Balance Sheet Financing Arrangement –(598) –
Payments for Businesses Acquired, net (727) (215) (235)
Proceeds from Sales of Businesses, net ––22
Proceeds from Sales of Property and Equipment 96 265 105
Purchases of Investments (25,890) (38,649) (38,367)
Proceeds from Sales and Maturities of Investments 25,990 38,534 38,623
Net Cash Used in Investing Activities (4,479) (4,171) (2,601)
CASH FLOWS FROM FINANCING ACTIVITIES:
Proceeds from Long-Term Borrowings, net of discount 995 –1
Repayments of Long-Term Debt (510) (9) –
Repurchase of Common Stock (3,106) (1,554) (2,000)
Proceeds from Sale of Common Stock, net 285 227 326
Cash Dividends Paid to Stockholders (719) (595) (492)
Net Cash Used in Financing Activities (3,055) (1,931) (2,165)
(Decrease) Increase in Cash and Cash Equivalents (630) 443 36
Effect of Exchange Rate Changes on Cash and Cash Equivalents 33 20 8
Cash and Cash Equivalents at Beginning of Year 1,103 640 596
Cash and Cash Equivalents at End of Year $506 $1,103 $640
SUPPLEMENTAL DISCLOSURE OF CASH PAYMENTS MADE FOR:
Interest, net of interest capitalized $78 $70 $50
Income Taxes $2,793 $2,037 $ 1,951
(1) Fiscal years ended January 30, 2005, February 1, 2004 and February 2, 2003 include 52 weeks.
See accompanying Notes to Consolidated Financial Statements.