Home Depot 2004 Annual Report Download - page 18
Download and view the complete annual report
Please find page 18 of the 2004 Home Depot annual report below. You can navigate through the pages in the report by either clicking on the pages listed below, or by using the keyword search tool below to find specific information within the annual report.-
 1
1 -
2
-
3
-
4
-
5
-
6
-
7
-
 8
8 -
 9
9 -
 10
10 -
 11
11 -
 12
12 -
 13
13 -
 14
14 -
 15
15 -
 16
16 -
 17
17 -
 18
18 -
 19
19 -
 20
20 -
 21
21 -
 22
22 -
 23
23 -
 24
24 -
 25
25 -
 26
26 -
 27
27 -
 28
28 -
29
-
30
-
31
-
32
-
33
-
34
-
35
-
36
-
37
-
38
-
39
-
40
-
41
-
42
-
43
-
44
-
45
-
46
-
47
-
48
 |
 |

Management’s Discussion and Analysis of
Results of Operations and Financial Condition (continued)
The Home Depot, Inc. and Subsidiaries
16
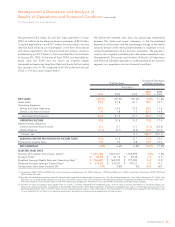
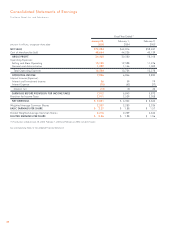
RESULTS OF OPERATIONS
For an understanding of the significant factors that influenced our
performance during the past three fiscal years, the following discus-
sion should be read in conjunction with the Consolidated
Financial Statements and the Notes to Consolidated Financial
Statements presented in this Annual Report.
Fiscal 2004 Compared to Fiscal 2003
Net Sales
Net Sales for fiscal 2004 increased 12.8% to $73.1 billion from
$64.8 billion for fiscal 2003. Fiscal 2004 Net Sales growth was
driven by an increase in comparable store sales of 5.4%, sales
from the 183 net new stores opened during fiscal 2004, sales from
the 175 net new stores opened during fiscal 2003 and sales
from our newly acquired businesses. We plan to open 175 new stores
during the fiscal year ending January 29, 2006, (“fiscal 2005”). We
expect sales growth of 9% to 12% for fiscal 2005, driven by compa-
rable store sales growth, sales from new stores opened during fiscal
2004 and fiscal 2005 and sales from newly acquired businesses.
The increase in comparable store sales in fiscal 2004, our best
performance since 1999, reflects a number of factors. Our average
ticket, which increased 7.3% to a company record of $54.89,
increased in all selling departments and our comparable store
sales growth in fiscal 2004 was positive in all selling departments.
We experienced strong comparable store sales increases in
building materials due in part to the impact of several hurricanes
in the Southeastern U.S. Lumber was another strong category
during fiscal 2004, driven primarily by commodity price inflation.
Additionally, we had strong sales growth in our kitchen and bath
categories, driven by appliances, bath fixtures, vanities and sinks.
Finally, our comparable store sales growth in fiscal 2004 reflects
the impact of cannibalization.
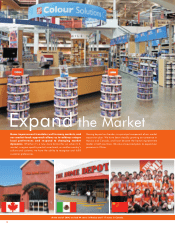
In order to meet our customer service objectives, we strategically
open stores near market areas served by existing stores (“cannibal-
ize”) to enhance service levels, gain incremental sales and increase
market penetration. As of the end of fiscal 2004, certain new stores
cannibalized approximately 17% of our existing stores and we esti-
mate that store cannibalization reduced fiscal 2004 comparable
store sales by approximately 2.2%. Additionally, we believe that our
sales performance has been, and could continue to be, negatively
impacted by the level of competition that we encounter in various
markets. However, due to the highly-fragmented U.S. home
improvement industry, in which we estimate our market share is
approximately 12%, measuring the impact on our sales by our
competitors is extremely difficult.
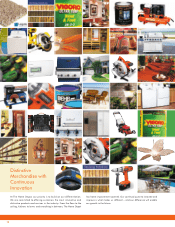
Comparable store sales in fiscal 2005 are estimated to increase 4%
to 7%. We expect our comparable store sales to be favorably
impacted by the introduction of innovative and distinctive new
merchandise as well as positive customer reaction to our ongoing
store modernization program. Increased customer traffic, traffic
conversion and higher average ticket are key to our 2005 sales
growth forecast. This forecast of comparable store sales growth is
net of an estimated cannibalization impact of about 2%. We do not
believe that changing prices for commodities will have a material
effect on Net Sales or results of operations in fiscal 2005.
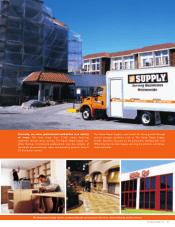
The growth in Net Sales for fiscal 2004 reflects growth in services
revenue, which increased 28% to $3.6 billion for fiscal 2004 from
$2.8 billion for fiscal 2003, driven by strength in a number of
areas including countertops, HVAC, kitchens and our flooring
companies. We continued to drive our services programs, which
focus primarily on providing products and services to our do-it-for-
me customers. These programs are offered through Home Depot
and EXPO Design Center stores. We also arrange for the provision
of flooring, countertop and window coverings installation services
to production homebuilders through HD Builder Solutions Group,
Inc. Our services revenue is expected to benefit from the growing
percentage of mature customers as they rely more heavily on
installation services.
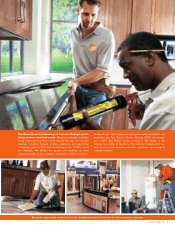
During fiscal 2004, we continued the implementation or expansion
of a number of in-store initiatives. We believe these initiatives will
enhance our customers’ shopping experience as they are fully
implemented in our stores. The Pro initiative adds programs to our
stores like job lot order quantities of merchandise and a dedicated
sales desk for our Pro customer base. Our Appliance initiative
offers customers an assortment of in-stock name brand appliances,
including General Electric®and Maytag®, and offers the ability to
special order over 2,300 additional related products through
computer kiosks located in the stores. Our DesignplaceSM initiative
offers our design and décor customers personalized service from
specially-trained associates and provides distinctive merchandise in
an attractive setting. Our Tool Rental Centers, which are located
inside our stores, provide a cost effective way for our do-it-yourself
and Pro customers to rent tools to complete home improvement
projects. During fiscal 2004, we opened our 1,000th Tool Rental
Center, making us the largest in the industry as measured by
number of locations.