Home Depot 2004 Annual Report Download - page 26
Download and view the complete annual report
Please find page 26 of the 2004 Home Depot annual report below. You can navigate through the pages in the report by either clicking on the pages listed below, or by using the keyword search tool below to find specific information within the annual report.-
 1
1 -
2
-
3
-
4
-
5
-
6
-
7
-
8
-
9
-
10
-
11
-
12
-
13
-
14
-
15
-
 16
16 -
 17
17 -
 18
18 -
 19
19 -
 20
20 -
 21
21 -
 22
22 -
 23
23 -
 24
24 -
 25
25 -
 26
26 -
 27
27 -
 28
28 -
 29
29 -
 30
30 -
 31
31 -
 32
32 -
 33
33 -
 34
34 -
 35
35 -
 36
36 -
37
-
38
-
39
-
40
-
41
-
42
-
43
-
44
-
45
-
46
-
47
-
48
 |
 |

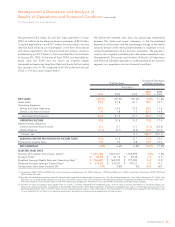
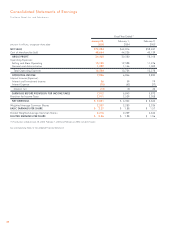
Consolidated Statements of Earnings
The Home Depot, Inc. and Subsidiaries
24
Fiscal Year Ended
(1)
January 30, February 1, February 2,
amounts in millions, except per share data
2005 2004 2003
NET SALES
$73,094 $64,816 $58,247
Cost of Merchandise Sold 48,664 44,236 40,139
GROSS PROFIT
24,430 20,580 18,108
Operating Expenses:
Selling and Store Operating 15,105 12,588 11,276
General and Administrative 1,399 1,146 1,002
Total Operating Expenses 16,504 13,734 12,278
OPERATING INCOME
7,926 6,846 5,830
Interest Income (Expense):
Interest and Investment Income 56 59 79
Interest Expense (70) (62) (37)
Interest, net (14) (3) 42
EARNINGS BEFORE PROVISION FOR INCOME TAXES
7,912 6,843 5,872
Provision for Income Taxes 2,911 2,539 2,208
NET EARNINGS
$ 5,001 $ 4,304 $ 3,664
Weighted Average Common Shares 2,207 2,283 2,336
BASIC EARNINGS PER SHARE
$ 2.27 $ 1.88 $ 1.57
Diluted Weighted Average Common Shares 2,216 2,289 2,344
DILUTED EARNINGS PER SHARE
$ 2.26 $ 1.88 $ 1.56
(1) Fiscal years ended January 30, 2005, February 1, 2004 and February 2, 2003 include 52 weeks.
See accompanying Notes to Consolidated Financial Statements.