Home Depot 2004 Annual Report Download - page 41
Download and view the complete annual report
Please find page 41 of the 2004 Home Depot annual report below. You can navigate through the pages in the report by either clicking on the pages listed below, or by using the keyword search tool below to find specific information within the annual report.-
 1
1 -
2
-
3
-
4
-
5
-
6
-
7
-
8
-
9
-
10
-
11
-
12
-
13
-
14
-
15
-
16
-
17
-
18
-
19
-
20
-
21
-
22
-
23
-
24
-
25
-
26
-
27
-
28
-
29
-
30
-
 31
31 -
 32
32 -
 33
33 -
 34
34 -
 35
35 -
 36
36 -
 37
37 -
 38
38 -
 39
39 -
 40
40 -
 41
41 -
 42
42 -
 43
43 -
 44
44 -
 45
45 -
 46
46 -
 47
47 -
 48
48
 |
 |

Notes to Consolidated Financial Statements (continued)
The Home Depot, Inc. and Subsidiaries
39The Home Depot, Inc.
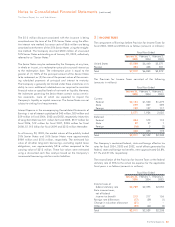
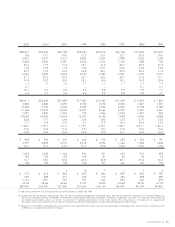
10 |QUARTERLY FINANCIAL DATA (UNAUDITED)
The following is a summary of the quarterly consolidated results of operations for the fiscal years ended January 30, 2005 and February 1, 2004
(dollars in millions, except per share data):
Increase (Decrease) Basic Diluted
Net in Comparable Gross Net Earnings Earnings
Sales Store Sales
(1)
Profit Earnings per Share per Share
Fiscal Year Ended January 30, 2005:
First Quarter $17,550 7.7% $ 5,768 $1,098 $0.49 $0.49
Second Quarter 19,960 4.8% 6,661 1,545 0.70 0.70
Third Quarter 18,772 4.5% 6,252 1,317 0.60 0.60
Fourth Quarter 16,812 4.6% 5,749 1,041 0.48 0.47
Fiscal Year $73,094 5.4% $24,430 $5,001 $2.27 $2.26
Fiscal Year Ended February 1, 2004:
First Quarter $15,104 (1.6)% $ 4,829 $ 907 $0.40 $0.39
Second Quarter 17,989 2.2% 5,605 1,299 0.57 0.56
Third Quarter 16,598 7.8% 5,193 1,147 0.50 0.50
Fourth Quarter 15,125 7.6% 4,953 951 0.42 0.42
Fiscal Year $64,816 3.8% $20,580 $4,304 $1.88 $1.88
Note: The quarterly data may not sum to fiscal year totals due to rounding.
(1) Includes net sales at locations open greater than 12 months, including relocated and remodeled stores, and net sales of all the subsidiaries of The Home Depot, Inc.
Stores and subsidiaries become comparable on the Monday following their 365th day of operation. We believe comparable store sales is a meaningful measurement of our
operating performance and is a common measurement of operating performance in the retail industry. This measurement is intended only as supplemental information, and
is not a substitute for net sales or net earnings presented in accordance with generally accepted accounting principles.