Home Depot 2004 Annual Report Download - page 21
Download and view the complete annual report
Please find page 21 of the 2004 Home Depot annual report below. You can navigate through the pages in the report by either clicking on the pages listed below, or by using the keyword search tool below to find specific information within the annual report.-
 1
1 -
2
-
3
-
4
-
5
-
6
-
7
-
8
-
9
-
10
-
 11
11 -
 12
12 -
 13
13 -
 14
14 -
 15
15 -
 16
16 -
 17
17 -
 18
18 -
 19
19 -
 20
20 -
 21
21 -
 22
22 -
 23
23 -
 24
24 -
 25
25 -
 26
26 -
 27
27 -
 28
28 -
 29
29 -
 30
30 -
 31
31 -
32
-
33
-
34
-
35
-
36
-
37
-
38
-
39
-
40
-
41
-
42
-
43
-
44
-
45
-
46
-
47
-
48
 |
 |

Management’s Discussion and Analysis of
Results of Operations and Financial Condition (continued)
The Home Depot, Inc. and Subsidiaries
19The Home Depot, Inc.
as we had fewer stores under development in fiscal 2003 as
compared to fiscal 2002. Interest Expense also increased due to the
addition of $47 million in capital leases during the year. Interest
and Investment Income decreased 25.3% to $59 million for fiscal
2003 from $79 million for fiscal 2002 primarily due to lower aver-
age cash balances and a lower interest rate environment.
Provision for Income Taxes
Our combined federal and state effective income tax rate
decreased to 37.1% for fiscal 2003 from 37.6% for fiscal 2002.
The decrease in our effective tax rate in fiscal 2003 from fiscal
2002 was primarily due to the utilization of certain federal, state
and foreign tax benefits not previously recognized.
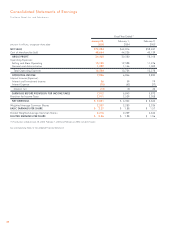
Diluted Earnings per Share
Diluted Earnings per Share were $1.88 and $1.56 for fiscal 2003
and fiscal 2002, respectively. Diluted Earnings per Share were
favorably impacted in fiscal 2003 as a result of the repurchase of
shares of our common stock in fiscal 2002 and fiscal 2003.
IMPACT OF THE ADOPTION OF EITF 02-16
In fiscal 2003, we adopted EITF 02-16 which states that certain
cash consideration received from a vendor is presumed to be a
reduction of the prices of the vendor’s products or services and
should, therefore, be recorded as a reduction of Cost of
Merchandise Sold when recognized in our Consolidated Statements
of Earnings. That presumption is overcome when the consideration
is either a reimbursement of specific, incremental and identifiable
costs incurred to sell the vendor’s products or a payment for assets
or services delivered to the vendor. We received consideration in
the form of advertising co-op allowances from our vendors
pursuant to annual agreements, which are generally on a calendar
year basis. As permitted by EITF 02-16, we elected to apply its
provisions prospectively to all agreements entered into or modified
after December 31, 2002. Therefore, the impact of us adopting
EITF 02-16 in fiscal 2003 was limited to advertising co-op
allowances earned pursuant to vendor agreements entered into in
late 2003, which became effective in January 2004.
The one-month impact of the adoption of EITF 02-16 in fiscal 2003
resulted in a reduction of Cost of Merchandise Sold of $40 million,
an increase in Selling and Store Operating Expenses of $47 million
and a reduction of Earnings before Provision for Income Taxes of
$7 million. The impact on our Diluted Earnings per Share was
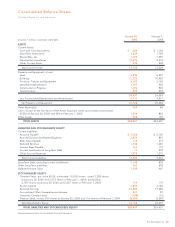
immaterial. Merchandise Inventories in our accompanying
Consolidated Balance Sheets as of February 1, 2004 were also
reduced by $7 million.
The impact of the adoption of EITF 02-16 in fiscal 2004 resulted in
a reduction of Cost of Merchandise Sold of $891 million, an increase
in Selling and Store Operating Expenses of $1.0 billion and a reduc-
tion of Earnings before Provision for Income Taxes of $158 million.
The impact on our Diluted Earnings per Share for fiscal 2004 was a
reduction of $0.04 per share. We do not expect any further impact
on our Diluted Earnings per Share from the adoption of EITF 02-16.
Merchandise Inventories in our accompanying Consolidated Balance
Sheets as of January 30, 2005 were also reduced by $158 million.
Prior to the adoption of EITF 02-16 in fiscal 2003, the entire amount
of advertising co-op allowances received was offset against adver-
tising expense and resulted in a reduction of Selling and Store
Operating Expenses. In fiscal 2002, advertising co-op allowances
exceeded gross advertising expense by $30 million. This excess
amount was recorded as a reduction of Cost of Merchandise
Sold in the accompanying Consolidated Statements of Earnings. We
continue to earn certain advertising co-op allowances that are
recorded as an offset against advertising expenses as they are reim-
bursements of specific, incremental and identifiable costs incurred
to promote vendors’ products. In fiscal 2004 and fiscal 2003, net
advertising expense was $1.0 billion and $58 million, respectively,
which was recorded in Selling and Store Operating Expenses.
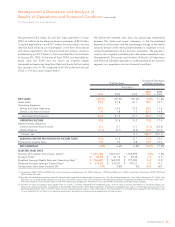
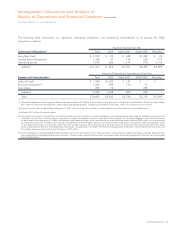
The following table illustrates the full-year effect on Cost of
Merchandise Sold, Gross Profit, Selling and Store Operating
Expenses, Operating Income and Diluted Earnings per Share as if
advertising co-op allowances had always been treated as a reduc-
tion of Cost of Merchandise Sold in accordance with EITF 02-16
(amounts in millions, except per share data):
Fiscal Year Ended
January 30, February 1, February 2,
2005 2004 2003
Cost of
Merchandise Sold
As Reported $48,664 $44,236 $40,139
Pro Forma 48,524 43,295 39,284
Gross Profit
As Reported 24,430 20,580 18,108
Pro Forma 24,570 21,521 18,963
Selling and Store
Operating Expenses
As Reported 15,105 12,588 11,276
Pro Forma 15,105 13,529 12,157
Operating Income
As Reported 7,926 6,846 5,830
Pro Forma 8,066 6,846 5,804
Diluted Earnings
per Share
As Reported $2.26 $1.88 $ 1.56
Pro Forma $ 2.30 $ 1.88 $ 1.56