Home Depot 2004 Annual Report Download - page 20
Download and view the complete annual report
Please find page 20 of the 2004 Home Depot annual report below. You can navigate through the pages in the report by either clicking on the pages listed below, or by using the keyword search tool below to find specific information within the annual report.
Management’s Discussion and Analysis of
Results of Operations and Financial Condition (continued)
The Home Depot, Inc. and Subsidiaries
18
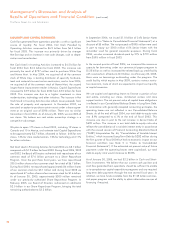
Provision for Income Taxes
Our combined federal and state effective income tax rate
decreased to 36.8% for fiscal 2004 from 37.1% for fiscal 2003.
The majority of this reduction was due to the reversal of a
$31 million valuation allowance as we were able to recognize
previous capital losses for which no tax benefit had been recorded
at the time the capital loss was incurred.
Diluted Earnings per Share
Diluted Earnings per Share were $2.26 and $1.88 for fiscal 2004
and fiscal 2003, respectively. The adoption of EITF 02-16 nega-
tively impacted Diluted Earnings per Share for fiscal 2004 by $0.04
per share. Diluted Earnings per Share were favorably impacted
in fiscal 2004 as a result of the repurchase of shares of our
common stock in fiscal 2003 and fiscal 2004. Over the past three
fiscal years, we have repurchased 200.5 million shares of our
common stock for a total of $6.7 billion. In fiscal 2005, we
estimate Diluted Earnings per Share growth of 10% to 14%.
Fiscal 2003 Compared to Fiscal Year Ended
February 2, 2003 (“Fiscal 2002”)
Net Sales
Net Sales for fiscal 2003 increased 11.3% to $64.8 billion from
$58.2 billion for fiscal 2002. Fiscal 2003 Net Sales growth was
driven by an increase in comparable store sales of 3.8%, sales from
the 175 net new stores opened during fiscal 2003 and sales from the
203 net new stores opened during fiscal 2002.
The increase in comparable store sales in fiscal 2003 reflects a
number of factors. Comparable store sales growth in fiscal 2003
was positive in all selling departments. Our lawn and garden cate-
gory was the biggest driver of the increase in comparable store
sales for fiscal 2003, reflecting strong sales in outdoor power
equipment, including John Deere®tractors and walk-behind
mowers, as well as snow throwers and snow blowers. Lumber was
another strong category during fiscal 2003, driven primarily by
commodity price inflation. Additionally, we had strong sales growth
in our kitchen and bath categories and in our paint department
reflecting the positive impact of new merchandising initiatives.
During fiscal 2003, we added our Appliance initiative to 826 of our
stores bringing the total number of stores with our Appliance initia-
tive to 1,569 as of the end of fiscal 2003. Additionally, during fiscal
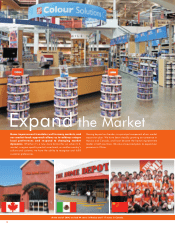
2003, each store was set with our new Color Solutions Center,
which drove sales growth in interior and exterior paint, as well as
pressure washers. Finally, our comparable store sales growth in
fiscal 2003 reflects the impact of cannibalization.
As of the end of fiscal 2003, certain new stores cannibalized
approximately 17% of our existing stores and we estimate that store
cannibalization reduced fiscal 2003 comparable store sales by
approximately 2.7%.
The growth in Net Sales for fiscal 2003 reflects growth in services
revenue, which increased 40% to $2.8 billion in fiscal 2003 from
$2.0 billion in fiscal 2002, driven by strength in a number of areas
including countertops, HVAC, kitchens and our flooring companies.
Gross Profit
Gross Profit increased 13.7% to $20.6 billion for fiscal 2003 from
$18.1 billion for fiscal 2002. Gross Profit as a percent of Net Sales
was 31.8% for fiscal 2003 compared to 31.1% for fiscal 2002. The
increase in the gross profit rate was attributable to changing customer
preferences and continuing benefits arising from our centralized
purchasing group. Improved inventory management, which resulted
in lower shrink levels, increased penetration of import products, which
typically have a lower cost, and benefits from Tool Rental Centers also
positively impacted the gross profit rate. The adoption of EITF 02-16
also contributed to the increase in Gross Profit in fiscal 2003. The one-
month impact of EITF 02-16 in fiscal 2003 resulted in a reduction of
Cost of Merchandise Sold of $40 million.
Operating Expenses
Operating Expenses increased 11.9% to $13.7 billion for fiscal
2003 from $12.3 billion for fiscal 2002. Operating Expenses as
a percent of Net Sales were 21.2% for fiscal 2003 compared to
21.1% for fiscal 2002.
Selling and Store Operating Expenses, which are included in
Operating Expenses, increased 11.6% to $12.6 billion for fiscal
2003 from $11.3 billion for fiscal 2002. As a percent of Net Sales,
Selling and Store Operating Expenses were 19.4% for fiscal 2003
and fiscal 2002. The increase in Selling and Store Operating
Expenses in fiscal 2003 included $47 million of advertising expense
related to the adoption of EITF 02-16. During fiscal 2003, we
experienced rising workers’ compensation and general liability
expense, due to rising medical costs. We also experienced incre-
mental expense associated with our store modernization program.
These rising costs were offset, however, by increasing levels of sales
productivity by our associates and benefits from our new private
label credit program.
General and Administrative Expenses, which are included in Operating
Expenses, increased 14.4% to $1.1 billion for fiscal 2003 from
$1.0 billion for fiscal 2002. General and Administrative Expenses as a
percent of Net Sales were 1.8% for fiscal 2003 and 1.7% for fiscal
2002. The increase in fiscal 2003 was primarily due to increased
spending in technology and other growth initiatives.
Interest, net
In fiscal 2003, we recognized $3 million of net Interest Expense
compared to $42 million of net Interest and Investment Income in
fiscal 2002. Net Interest Expense as a percent of Net Sales was less
than 0.1% for fiscal 2003 and net Interest and Investment Income as
a percent of Net Sales was 0.1% for fiscal 2002. Interest Expense
increased 67.6% to $62 million for fiscal 2003 from $37 million
for fiscal 2002 primarily due to lower capitalized interest expense


