Home Depot 2004 Annual Report Download - page 19
Download and view the complete annual report
Please find page 19 of the 2004 Home Depot annual report below. You can navigate through the pages in the report by either clicking on the pages listed below, or by using the keyword search tool below to find specific information within the annual report.-
 1
1 -
2
-
3
-
4
-
5
-
6
-
7
-
8
-
 9
9 -
 10
10 -
 11
11 -
 12
12 -
 13
13 -
 14
14 -
 15
15 -
 16
16 -
 17
17 -
 18
18 -
 19
19 -
 20
20 -
 21
21 -
 22
22 -
 23
23 -
 24
24 -
 25
25 -
 26
26 -
 27
27 -
 28
28 -
 29
29 -
30
-
31
-
32
-
33
-
34
-
35
-
36
-
37
-
38
-
39
-
40
-
41
-
42
-
43
-
44
-
45
-
46
-
47
-
48
 |
 |

Management’s Discussion and Analysis of
Results of Operations and Financial Condition (continued)
The Home Depot, Inc. and Subsidiaries
17The Home Depot, Inc.
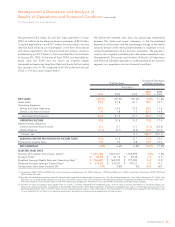
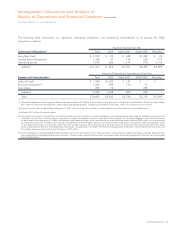
The following table provides the number of stores with these initiatives:
Fiscal Year
2005 Fiscal Year
Estimate 2004 2003 2002
Store Count 2,065 1,890 1,707 1,532
Initiatives:
Pro 1,728 1,563 1,356 1,135
Appliance 1,952 1,787 1,569 743
DesignplaceSM 1,952 1,787 1,625 873
Tool Rental Centers 1,186 1,061 825 601
Gross Profit
Gross Profit increased 18.7% to $24.4 billion for fiscal 2004 from
$20.6 billion for fiscal 2003, an increase of 167 basis points. Gross
Profit as a percent of Net Sales was 33.4% for fiscal 2004, the
highest annual rate in our company’s history, compared to 31.8%
for fiscal 2003. The adoption of Emerging Issues Task Force (“EITF”)
02-16, “Accounting by a Customer (Including a Reseller) for Certain
Consideration Received from a Vendor” (“EITF 02-16”), reduced
our Cost of Merchandise Sold by co-op advertising allowances of
$891 million, or 122 basis points, in fiscal 2004 and $40 million, or
6 basis points, in fiscal 2003. See section “Impact of the Adoption of
EITF 02-16.” Excluding the impact of the adoption of EITF 02-16, our
gross margin would have been 32.2% for fiscal 2004 compared with
31.7% for fiscal 2003. Improved inventory management, which
resulted in lower shrink levels, contributed 18 basis points of our
increase in gross profit. Finally, 33 basis points resulted from benefits
arising from a change in merchandising mix, offset by the cost of our
deferred interest programs, as the cost of these programs is reflected
in our gross margin. Our deferred interest programs offer no interest
and no payment programs over a six or twelve-month period
through our private label credit card. We believe these programs
deliver long-term benefits, including higher average tickets and
customer loyalty.
Operating Expenses
Operating Expenses increased 20.2% to $16.5 billion for fiscal
2004 from $13.7 billion for fiscal 2003. Operating Expenses as a
percent of Net Sales were 22.6% for fiscal 2004 compared to
21.2% for fiscal 2003.
Selling and Store Operating Expenses, which are included in
Operating Expenses, increased 20.0% to $15.1 billion for fiscal
2004 from $12.6 billion for fiscal 2003. As a percent of Net Sales,
Selling and Store Operating Expenses were 20.7% for fiscal 2004
compared to 19.4% for fiscal 2003. The increase in Selling and
Store Operating Expenses in fiscal 2004 includes $1.0 billion of
advertising expense related to the adoption of EITF 02-16.
Excluding the impact of EITF 02-16, Selling and Store Operating
Expenses increased 12.1% to $14.1 billion, or 19.2% of Net Sales,
in fiscal 2004 compared with 19.4% of Net Sales in fiscal 2003.
The decrease in Selling and Store Operating Expenses as a percent
of Net Sales for fiscal 2004, excluding the impact of EITF 02-16,
was due to an increase in labor productivity and benefits from our
private label credit card, which carries a lower discount rate than
other forms of credit, like bank cards. Labor productivity, as meas-
ured by sales per labor hour, reached an all-time high in fiscal
2004, as we moved our associates from tasking to selling activities.
This reduction in costs was partially offset by higher expenses asso-
ciated with incentive programs, like our success sharing program
and our management incentive plan. In addition, our planned
investment in store modernization and technology caused remodel
and repair expenses as well as depreciation expense to rise at a
faster rate than our sales growth.
General and Administrative Expenses, which are included in
Operating Expenses, increased 22.1% to $1.4 billion for fiscal
2004 from $1.1 billion for fiscal 2003. General and Administrative
Expenses as a percent of Net Sales were 1.9% for fiscal 2004 and
1.8% for fiscal 2003. The increase in fiscal 2004 was primarily due
to expenses associated with incentive programs and stock-based
compensation expense.
While we will continue to drive productivity, our expenses will be under
pressure in fiscal 2005 for two primary reasons. Given our continued
reinvestment in our business in prior years and our capital expenditure
forecast of $3.7 billion for fiscal 2005, our total depreciation expense
is estimated to increase by approximately $250 million to approxi-
mately $1.6 billion for fiscal 2005, of which approximately $1.3 billion
and $300 million are included in Selling and Store Operating
Expenses and General and Administrative Expenses, respectively. Stock-
based compensation expense is estimated to increase by $125 million
in fiscal 2005 with approximately $65 million of the increase due
to the adoption of Statement of Financial Accounting Standards
(“SFAS”) No. 123(R), “Share-Based Payment” (“SFAS 123(R)”). See
section “Recent Accounting Pronouncements.”
Interest, net
In fiscal 2004, we recognized $14 million of net Interest Expense
compared to $3 million in fiscal 2003. Net Interest Expense as a
percent of Net Sales was less than 0.1% for both fiscal 2004 and
fiscal 2003. Interest Expense increased 12.9% to $70 million for fiscal
2004 from $62 million for fiscal 2003 primarily due to an increase
in outstanding indebtedness and a reduction in the amount of capi-
talized interest. Interest Expense also increased due to the addition of
$38 million in capital leases during the year. Interest and Investment
Income decreased 5.1% to $56 million for fiscal 2004 from $59 mil-
lion for fiscal 2003 primarily due to a lower interest rate environment.