Home Depot 2004 Annual Report Download - page 37
Download and view the complete annual report
Please find page 37 of the 2004 Home Depot annual report below. You can navigate through the pages in the report by either clicking on the pages listed below, or by using the keyword search tool below to find specific information within the annual report.-
 1
1 -
2
-
3
-
4
-
5
-
6
-
7
-
8
-
9
-
10
-
11
-
12
-
13
-
14
-
15
-
16
-
17
-
18
-
19
-
20
-
21
-
22
-
23
-
24
-
25
-
26
-
 27
27 -
 28
28 -
 29
29 -
 30
30 -
 31
31 -
 32
32 -
 33
33 -
 34
34 -
 35
35 -
 36
36 -
 37
37 -
 38
38 -
 39
39 -
 40
40 -
 41
41 -
 42
42 -
 43
43 -
 44
44 -
 45
45 -
 46
46 -
 47
47 -
48
 |
 |

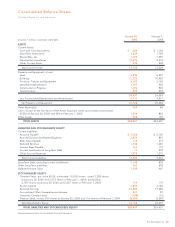
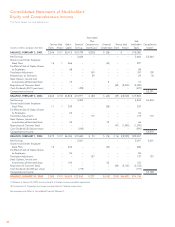
Notes to Consolidated Financial Statements (continued)
The Home Depot, Inc. and Subsidiaries
35The Home Depot, Inc.
The Company maintains two employee stock purchase plans
(U.S. and non-U.S. plans). The plan for U.S. associates is a
tax-qualified plan under Section 423 of the Internal Revenue
Code. The non-U.S. plan is not a Section 423 plan. The ESPPs
allow associates to purchase up to 152 million shares of common
stock, of which 114 million shares (adjusted for subsequent stock
splits) have been purchased from inception of the plans. Prior to
July 1, 2004, shares under the ESPPs were purchased at a price
equal to the lower of 85% of the stock’s fair market value on the
first day or the last day of the purchase period. Beginning July 1,
2004, the purchase price of shares under the ESPPs was equal to
85% of the stock’s fair market value on the last day of the
purchase period. These shares were included in the pro forma
calculation of stock-based compensation expense included in
Note 1 under the caption “Stock-Based Compensation.” During
fiscal 2004, 2.7 million shares were purchased under the ESPPs at
an average price of $32.74 per share. Under the outstanding
ESPPs as of January 30, 2005, employees have contributed
$9 million to purchase shares at 85% of the stock’s fair market
value on the last day (June 30, 2005) of the purchase period. The
Company had 38 million shares available for issuance under
the ESPPs at January 30, 2005.
As of January 30, 2005, there were 2.5 million non-qualified stock
options and 1.4 million deferred stock units outstanding under
non-qualified stock option and deferred stock unit plans that are
not part of the 1997 Plan. During fiscal 2004, 2003 and 2002, the
Company did not grant any deferred stock units under the deferred
unit plans that are not part of the 1997 Plan. In fiscal 2004 and
2003, there were 461,000 and 635,000 deferred units, respec-
tively, granted under the 1997 Plan. No deferred units were
granted under the 1997 Plan in 2002. Each deferred stock unit
entitles the associate to one share of common stock to be received
up to five years after the vesting date of the deferred stock unit,
subject to certain deferral rights of the associate. The fair value of
the deferred stock units on the grant dates was $14 million and
$19 million for deferred units granted in fiscal 2004 and 2003,
respectively. These amounts are being expensed over the vesting
periods. The Company recorded stock-based compensation expense
related to deferred stock units of $14 million, $13 million and
$12 million in fiscal 2004, 2003 and 2002, respectively.
In total, the Company recorded stock-based compensation
expense, including the expense of stock options, ESPPs, restricted
stock and deferred stock units, of $125 million, $67 million and
$15 million, in fiscal 2004, 2003 and 2002, respectively.
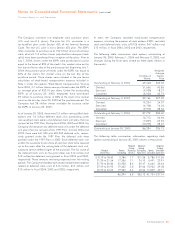
The following table summarizes stock options outstanding at
January 30, 2005, February 1, 2004 and February 2, 2003, and
changes during the fiscal years ended on these dates (shares in
thousands):
Weighted
Average
Number of Option
Shares Price
Outstanding at February 3, 2002 69,448 $33.33
Granted 31,656 40.86
Exercised (9,908) 18.27
Cancelled (8,030) 42.74
Outstanding at February 2, 2003 83,166 $37.09
Granted 19,234 24.97
Exercised (4,708) 16.03
Cancelled (9,913) 38.54
Outstanding at February 1, 2004 87,779 $35.40
Granted 16,713 36.46
Exercised (7,825) 25.94
Cancelled (10,273) 38.27
Outstanding at January 30, 2005 86,394 $36.12
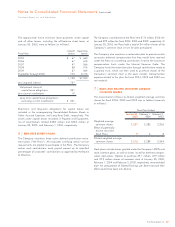
The following table summarizes information regarding stock
options outstanding at January 30, 2005 (shares in thousands):
Weighted Weighted Weighted
Average Average Average
Range of Options Remaining Outstanding Options Exercisable
Exercise Plans Outstanding Life (Yrs.) Option Price Exercisable Option Price
$8.19 to 18.60 3,786 1.7 $11.56 3,786 $11.56
21.29 to 31.56 17,356 7.1 24.10 5,491 22.91
31.92 to 36.84 25,928 8.4 35.47 4,665 34.43
37.29 to 40.95 19,362 5.8 39.66 15,963 39.58
42.55 to 53.00 19,962 6.4 48.64 11,829 49.71
86,394 6.8 $36.12 41,734 $37.14