Home Depot 2004 Annual Report Download - page 44
Download and view the complete annual report
Please find page 44 of the 2004 Home Depot annual report below. You can navigate through the pages in the report by either clicking on the pages listed below, or by using the keyword search tool below to find specific information within the annual report.-
 1
1 -
2
-
3
-
4
-
5
-
6
-
7
-
8
-
9
-
10
-
11
-
12
-
13
-
14
-
15
-
16
-
17
-
18
-
19
-
20
-
21
-
22
-
23
-
24
-
25
-
26
-
27
-
28
-
29
-
30
-
31
-
32
-
33
-
 34
34 -
 35
35 -
 36
36 -
 37
37 -
 38
38 -
 39
39 -
 40
40 -
 41
41 -
 42
42 -
 43
43 -
 44
44 -
 45
45 -
 46
46 -
 47
47 -
 48
48
 |
 |

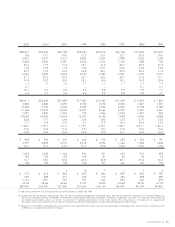
10-Year Summary of Financial and Operating Results
The Home Depot, Inc. and Subsidiaries
42
10-Year
Compound Annual
amounts in millions, except where noted
Growth Rate 2004 2003
STATEMENT OF EARNINGS DATA
Net sales 19.3% $73,094 $64,816
Net sales increase (%) –12.8 11.3
Earnings before provision for income taxes 23.2 7,912 6,843
Net earnings 23.5 5,001 4,304
Net earnings increase (%) –16.2 17.5
Diluted earnings per share ($)(2) 22.8 2.26 1.88
Diluted earnings per share increase (%) – 20.2 20.5
Diluted weighted average number of common shares 0.3 2,216 2,289
Gross margin– % of sales –33.4 31.8
Selling and store operating expense– % of sales – 20.7 19.4
General and administrative expense– % of sales – 1.9 1.8
Net interest income (expense)– % of sales – ––
Earnings before provision for income taxes– % of sales – 10.8 10.6
Net earnings– % of sales –6.8 6.6
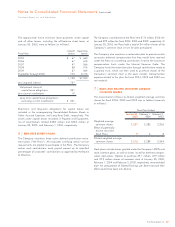
BALANCE SHEET DATA AND FINANCIAL RATIOS
Total assets 21.0% $38,907 $34,437
Working capital 14.8 3,661 3,774
Merchandise inventories 19.1 10,076 9,076
Net property and equipment 20.9 22,726 20,063
Long-term debt 8.1 2,148 856
Stockholders’ equity 21.5 24,158 22,407
Book value per share ($) 20.7 11.06 9.93
Total debt-to-equity (%) –8.9 6.1
Current ratio –1.35:1 1.40:1
Inventory turnover –4.9x 5.0x
Return on invested capital (%) –21.5 20.4
STATEMENT OF CASH FLOWS DATA
Depreciation and amortization 26.1% $1,319 $1,076
Capital expenditures(3) 12.5 3,948 3,508
Cash dividends per share ($) 26.9 0.325 0.26
STORE DATA
(4)
Number of stores 18.7% 1,890 1,707
Square footage at fiscal year-end 19.1 201 183
Increase in square footage (%) –9.8 10.2
Average square footage per store (in thousands) 0.3 106 107
STORE SALES AND OTHER DATA
Comparable store sales increase (%)(5)(6)(7) –5.4 3.8
Weighted average weekly sales per operating store (in thousands)(4) (0.5)% $ 766 $ 763
Weighted average sales per square foot ($) (4)(5) (0.7) 375 371
Number of customer transactions(4) 15.7 1,295 1,246
Average ticket ($)(4) 2.9 54.89 51.15
Number of associates at fiscal year-end 17.0 323,149 298,800
(1) Fiscal years 2001 and 1996 include 53 weeks; all other fiscal years reported include 52 weeks.
(2) Diluted earnings per share for fiscal 1997, excluding a $104 million non-recurring charge, were $0.55.
(3) Excludes payments for businesses acquired (net, in millions) for fiscal years 2004 ($727), 2003 ($215), 2002 ($235), 2001 ($190), 2000 ($26), 1999 ($101), 1998 ($6)
and 1997 ($61).
(4) Excludes all subsidiaries operating under The Home Depot Supply brand (Apex Supply Company, Inc., The Home Depot Supply, Inc., Your Other Warehouse, LLC, White Cap
Industries, Inc. and HD Builder Solutions Group, Inc.) since their inclusion may cause distortion of the data presented due to operational differences from the Company’s
retail stores. The total number of the excluded locations and their total number of locations and total square footage are immaterial to the Company’s total number of loca-
tions and total square footage.