Home Depot 2004 Annual Report Download - page 16
Download and view the complete annual report
Please find page 16 of the 2004 Home Depot annual report below. You can navigate through the pages in the report by either clicking on the pages listed below, or by using the keyword search tool below to find specific information within the annual report.-
 1
1 -
2
-
3
-
4
-
5
-
 6
6 -
 7
7 -
 8
8 -
 9
9 -
 10
10 -
 11
11 -
 12
12 -
 13
13 -
 14
14 -
 15
15 -
 16
16 -
 17
17 -
 18
18 -
 19
19 -
 20
20 -
 21
21 -
 22
22 -
 23
23 -
 24
24 -
 25
25 -
 26
26 -
27
-
28
-
29
-
30
-
31
-
32
-
33
-
34
-
35
-
36
-
37
-
38
-
39
-
40
-
41
-
42
-
43
-
44
-
45
-
46
-
47
-
48
 |
 |

Management’s Discussion and Analysis of
Results of Operations and Financial Condition
The Home Depot, Inc. and Subsidiaries
14
FORWARD-LOOKING STATEMENTS
Certain statements of The Home Depot’s expectations made
herein, including those regarding Net Sales growth, increases in
comparable store sales, impact of cannibalization, commodity
price inflation and deflation, implementation of store initiatives,
Net Earnings performance, including depreciation expense and
stock-based compensation expense, store openings, capital allo-
cation and expenditures, the effect of adopting certain accounting
standards, strategic direction and the demand for our products
and services, constitute “forward-looking statements” as defined in
the Private Securities Litigation Reform Act of 1995. These state-
ments are based on currently available information and are
subject to risks and uncertainties that could cause actual results to
differ materially from our historical experience and expectations.
These risks and uncertainties include economic conditions in North
America, changes in our cost structure, the availability of sourcing
channels consistent with our strategy of differentiation, conditions
affecting new store development, conditions affecting customer
transactions and average ticket, the success of our technology
initiatives in improving operations and customers’ in-store experi-
ence, our ability to identify and respond to evolving trends in
demographics and consumer preferences, the relative success of
our expansion strategy, including our ability to integrate acquisi-
tions and create appropriate distribution channels for key sales
platforms, our ability to attract, train and retain highly-qualified
associates, the impact of new accounting standards and the
impact of competition, decisions by management related to possible
asset impairments, regulation and litigation matters. Undue
reliance should not be placed on such forward-looking statements
as they speak only as of the date made. Additional information
regarding these and other risks is contained in our periodic filings
with the Securities and Exchange Commission.
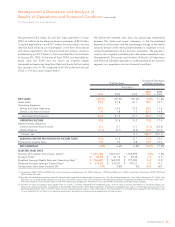
EXECUTIVE SUMMARY AND SELECTED CONSOLIDATED
STATEMENTS OF EARNINGS DATA
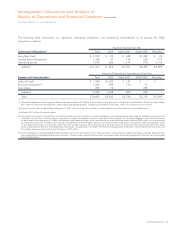
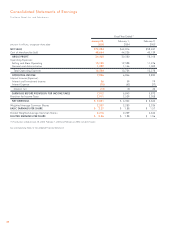
For fiscal year ended January 30, 2005 (“fiscal 2004”), we reported
Net Earnings of $5.0 billion and Diluted Earnings per Share of
$2.26 compared to Net Earnings of $4.3 billion and Diluted
Earnings per Share of $1.88 in fiscal year ended February 1, 2004
(“fiscal 2003”). Net Sales for fiscal 2004 increased 12.8% over fiscal
2003 to $73.1 billion. This growth in our business was achieved
through the continued execution of our strategy of enhancing the
core, extending the business and expanding the market. In the execu-
tion of our strategy, we invested $3.9 billion back into our business
and invested $727 million for acquisitions of new businesses during
fiscal 2004.
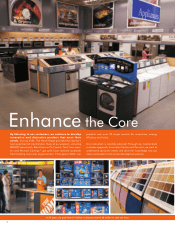
We enhanced our business by maintaining an aggressive pace of
introducing innovative and distinctive new merchandise, supported
by continued investments in store modernization and technology,
including major merchandising resets that reflect emerging
consumer trends. In fiscal 2004, we continued to invest in technol-
ogy through the installation of human resource and financial
systems to improve our operating systems and enable future
growth. Our technological enhancements also included the
conversion onto a new single point-of-sale platform in all stores in
the United States (“U.S.”), which allowed us to roll out cordless scan
guns to all U.S. stores and self-checkout registers to over 1,000
stores. These enhancements streamlined the front-end of our stores
and eliminated redundant tasks, allowing our associates to spend
more time with our customers. These investments in our core
business are paying off as evidenced by certain key operating
performance measurements, including comparable store sales,
which increased 5.4% in fiscal 2004 and sales per square foot
which increased 1.2% to $375.26. Average ticket also increased
7.3% in fiscal 2004 to $54.89, a company record, with growth in
every selling department. We achieved a record operating margin
of 10.8% for fiscal 2004.
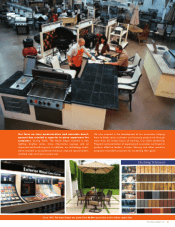
We extended our business by opening new stores and by offering
a variety of installation and home maintenance programs through
our Home Depot and EXPO Design Center stores. We currently
offer 23 national installation programs that provide products and
services to our do-it-for-me customers. We also arrange for the
provision of flooring, countertop and window coverings installation
services to production homebuilders through HD Builder Solutions
Group, Inc. Our services revenue increased 28% to $3.6 billion in
fiscal 2004, and we saw sustained growth in categories such as
carpet, countertops, kitchens, windows, HVAC, roofing and
sheds. We opened 183 net new stores during fiscal 2004, includ-
ing three new urban format stores, two in New York City and
one in Park Royal, West Vancouver, British Columbia, bringing our
total store count to 1,890. We also continued the expansion of
several initiatives including our Tool Rental Centers, Professional
Business Customer (“Pro”), Appliance and DesignplaceSM initiatives.
In response to the growing demand for online shopping, we
revamped our website, homedepot.com, making improvements in
the overall navigability of the site with more than 15,000 products
for sale, including appliances.
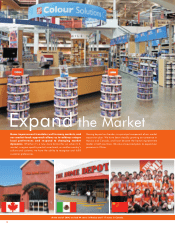
We have expanded our market by capturing a growing share of the
professional residential, commercial and heavy construction
markets which operate under our Home Depot Supply brand and
by continuing our expansion outside of the U.S. As part of this
expansion in 2004, we acquired White Cap Industries, Inc. (“White
Cap”), a leading distributor of specialty hardware, tools and mate-
rials to construction contractors. In fiscal 2004, we made several
important moves to expand our market and global presence. We
opened 15 new stores in Canada, bringing the total to 117, and
increased our footprint significantly in Mexico to 44 stores through
both organic growth and the acquisition of 20 Home Mart Mexico,
S.A. de C.V. (“Home Mart”) stores. In fiscal 2004, we also
announced our intention to enter the retail market in China.