Haier 2009 Annual Report Download - page 62
Download and view the complete annual report
Please find page 62 of the 2009 Haier annual report below. You can navigate through the pages in the report by either clicking on the pages listed below, or by using the keyword search tool below to find specific information within the annual report.-
 1
1 -
2
-
3
-
4
-
5
-
6
-
7
-
8
-
9
-
10
-
11
-
12
-
13
-
14
-
15
-
16
-
17
-
18
-
19
-
20
-
21
-
22
-
23
-
24
-
25
-
26
-
27
-
28
-
29
-
30
-
31
-
32
-
33
-
34
-
35
-
36
-
37
-
38
-
39
-
40
-
41
-
42
-
43
-
44
-
45
-
46
-
47
-
48
-
49
-
50
-
51
-
 52
52 -
 53
53 -
 54
54 -
 55
55 -
 56
56 -
 57
57 -
 58
58 -
 59
59 -
 60
60 -
 61
61 -
 62
62 -
 63
63 -
 64
64 -
 65
65 -
 66
66 -
 67
67 -
 68
68 -
 69
69 -
 70
70 -
 71
71 -
 72
72 -
73
-
74
-
75
-
76
-
77
-
78
-
79
-
80
-
81
-
82
-
83
-
84
-
85
-
86
-
87
-
88
-
89
-
90
-
91
-
92
-
93
-
94
-
95
-
96
-
97
-
98
-
99
-
100
-
101
-
102
-
103
-
104
-
105
-
106
-
107
-
108
-
109
-
110
-
111
-
112
-
113
-
114
-
115
-
116
-
117
-
118
-
119
-
120
-
121
-
122
-
123
-
124
-
125
-
126
-
127
-
128
-
129
-
130
-
131
-
132
-
133
-
134
-
135
-
136
-
137
-
138
-
139
-
140
-
141
-
142
-
143
-
144
-
145
-
146
-
147
-
148
-
149
-
150
-
151
-
152
-
153
-
154
-
155
-
156
-
157
-
158
-
159
-
160
-
161
-
162
-
163
-
164
 |
 |

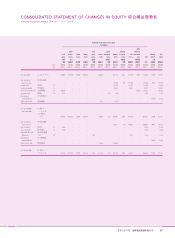
Year ended 31 December 2009
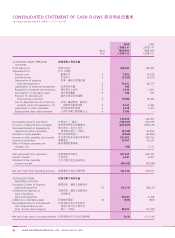
CONSOLIDATED STATEMENT OF CASH FLOWS 綜合現金流量表
HAIER ELECTRONICS GROUP CO., LTD ANNUAL REPORT 2009
60
2009 2008
年
Notes RMB’000 RMB’000
CASH FLOWS FROM OPERATING
ACTIVITIES
Profit before tax 538,046 180,506
Adjustments for:
Finance costs 7 7,906 14,038
Interest income 5 (5,281 ) (6,421 )
Depreciation of property,
plant and equipment 6 78,202 86,237
Depreciation of Investment properties 6 596 –
Recognition of prepaid land premiums 6 2,226 1,841
Amortisation of intangible assets 6 592 576
Provision for obsolete and
slow-moving inventories 6 17,586 35,680
Loss on disposal/write-off of items of
property, plant and equipment, net 6 9,166 4,906
Impairment of other receivables 6 3,329 7,087
Equity-settled share option expense 6 7,286 –
659,654 324,450
Decrease/(increase) in inventories (136,331 ) 309,578
Increase in trade and bills receivables (635,267 ) (852,187 )
Decrease/(increase) in prepayments,
deposits and other receivables (9,758 ) 69,874
Decrease in trade payables (9,865 ) (42,860 )
Increase in other payables and accruals 921,862 418,310
Increase in provisions 67,067 62,243
Effect of foreign exchange rate
changes, net (93 ) 6,131
Cash generated from operations 857,269 295,539
Interest received 5,281 6,421
Mainland China corporate
income tax paid (80,638 ) (45,949 )
Net cash flows from operating activities 781,912 256,011
CASH FLOWS FROM
INVESTING ACTIVITIES
Purchases of items of property,
plant and equipment 15 (70,211 ) (38,473 )
Proceeds from disposal of
items of property,
plant and equipment 20,839 2,268
Additions to intangible assets 18 (439 ) (805 )
Decrease/(increase) in time deposits
with original maturity over
three months when acquired 49,000 (74,000 )
Net cash flows used in investing activities (811 ) (111,010 )