Haier 2009 Annual Report Download - page 162
Download and view the complete annual report
Please find page 162 of the 2009 Haier annual report below. You can navigate through the pages in the report by either clicking on the pages listed below, or by using the keyword search tool below to find specific information within the annual report.-
 1
1 -
2
-
3
-
4
-
5
-
6
-
7
-
8
-
9
-
10
-
11
-
12
-
13
-
14
-
15
-
16
-
17
-
18
-
19
-
20
-
21
-
22
-
23
-
24
-
25
-
26
-
27
-
28
-
29
-
30
-
31
-
32
-
33
-
34
-
35
-
36
-
37
-
38
-
39
-
40
-
41
-
42
-
43
-
44
-
45
-
46
-
47
-
48
-
49
-
50
-
51
-
52
-
53
-
54
-
55
-
56
-
57
-
58
-
59
-
60
-
61
-
62
-
63
-
64
-
65
-
66
-
67
-
68
-
69
-
70
-
71
-
72
-
73
-
74
-
75
-
76
-
77
-
78
-
79
-
80
-
81
-
82
-
83
-
84
-
85
-
86
-
87
-
88
-
89
-
90
-
91
-
92
-
93
-
94
-
95
-
96
-
97
-
98
-
99
-
100
-
101
-
102
-
103
-
104
-
105
-
106
-
107
-
108
-
109
-
110
-
111
-
112
-
113
-
114
-
115
-
116
-
117
-
118
-
119
-
120
-
121
-
122
-
123
-
124
-
125
-
126
-
127
-
128
-
129
-
130
-
131
-
132
-
133
-
134
-
135
-
136
-
137
-
138
-
139
-
140
-
141
-
142
-
143
-
144
-
145
-
146
-
147
-
148
-
149
-
150
-
151
-
 152
152 -
 153
153 -
 154
154 -
 155
155 -
 156
156 -
 157
157 -
 158
158 -
 159
159 -
 160
160 -
 161
161 -
 162
162 -
 163
163 -
 164
164
 |
 |

FIVE YEAR FINANCIAL SUMMARY 年財務要
HAIER ELECTRONICS GROUP CO., LTD ANNUAL REPORT 2009
160
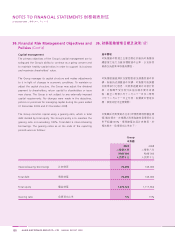
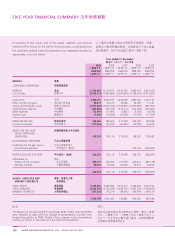
A summary of the results and of the assets, liabilities and minority
interests of the Group for the last five financial years, as extracted from
the published audited financial statements and restated/reclassified as
appropriate, is set out below.
Year ended 31 December
年
2009 2008 2007 2006 2005
年
RMB'000 RMB'000 RMB'000 RMB'000 RMB'000
RESULTS
CONTINUING OPERATIONS
REVENUE 11,530,604 10,179,764 8,332,592 7,082,304 5,837,076
Cost of sales (8,084,214 ) (7,244,969 ) (5,904,494 ) (5,194,664 ) (4,513,939 )
Gross profit 3,446,390 2,934,795 2,428,098 1,887,640 1,323,137
Other income and gains 30,317 30,770 33,646 44,083 11,181
Selling and distribution costs (2,297,564 ) (2,023,703 ) (1,604,933 ) (1,276,285 ) (847,765 )
Administrative expenses (620,696 ) (735,325 ) (513,714 ) (412,190 ) (279,281 )
Other expenses (12,495 ) (11,993 ) (5,841 ) (2,505 ) (6,338 )
Finance costs (7,906 ) (14,038 ) (23,458 ) (11,399 ) (17,025 )
PROFIT BEFORE TAX 538,046 180,506 313,798 229,344 183,909
Income tax expense (117,692 ) (24,390 ) (93,820 ) (40,749 ) (24,227 )
PROFIT FOR THE YEAR 年
FROM CONTINUING
OPERATIONS 420,354 156,116 219,978 188,595 159,682
DISCONTINUED OPERATION
Profit/(loss) for the year from a
discontinued operation – – – 106,124 (504,654 )
PROFIT/(LOSS) FOR THE YEAR 年 420,354 156,116 219,978 294,719 (344,972 )
Attributable to:
Owners of the Company 369,711 135,780 167,769 269,212 (383,178 )
Minority interests 50,643 20,336 52,209 25,507 38,206
420,354 156,116 219,978 294,719 (344,972 )
ASSETS, LIABILITIES AND
MINORITY INTERESTS
TOTAL ASSETS 5,234,506 3,839,388 3,430,213 3,384,449 3,663,325
TOTAL LIABILITIES (3,662,383 ) (2,722,026 ) (2,548,735 ) (2,583,238 ) (2,508,640 )
MINORITY INTERESTS (131,325 ) (95,270 ) (88,626 ) (154,959 ) (169,137 )
1,440,798 1,022,092 792,852 646,252 985,548
Note:
The figures for the year ended 31 December 2005, 2006, 2007 and 2008
were restated to align with the change of presentation currency from
Hong Kong dollars to RMB. Details of the change in the presentation
currency is setout in the note 2 to the financial statements.
2