Haier 2009 Annual Report Download - page 120
Download and view the complete annual report
Please find page 120 of the 2009 Haier annual report below. You can navigate through the pages in the report by either clicking on the pages listed below, or by using the keyword search tool below to find specific information within the annual report.-
 1
1 -
2
-
3
-
4
-
5
-
6
-
7
-
8
-
9
-
10
-
11
-
12
-
13
-
14
-
15
-
16
-
17
-
18
-
19
-
20
-
21
-
22
-
23
-
24
-
25
-
26
-
27
-
28
-
29
-
30
-
31
-
32
-
33
-
34
-
35
-
36
-
37
-
38
-
39
-
40
-
41
-
42
-
43
-
44
-
45
-
46
-
47
-
48
-
49
-
50
-
51
-
52
-
53
-
54
-
55
-
56
-
57
-
58
-
59
-
60
-
61
-
62
-
63
-
64
-
65
-
66
-
67
-
68
-
69
-
70
-
71
-
72
-
73
-
74
-
75
-
76
-
77
-
78
-
79
-
80
-
81
-
82
-
83
-
84
-
85
-
86
-
87
-
88
-
89
-
90
-
91
-
92
-
93
-
94
-
95
-
96
-
97
-
98
-
99
-
100
-
101
-
102
-
103
-
104
-
105
-
106
-
107
-
108
-
109
-
 110
110 -
 111
111 -
 112
112 -
 113
113 -
 114
114 -
 115
115 -
 116
116 -
 117
117 -
 118
118 -
 119
119 -
 120
120 -
 121
121 -
 122
122 -
 123
123 -
 124
124 -
 125
125 -
 126
126 -
 127
127 -
 128
128 -
 129
129 -
 130
130 -
131
-
132
-
133
-
134
-
135
-
136
-
137
-
138
-
139
-
140
-
141
-
142
-
143
-
144
-
145
-
146
-
147
-
148
-
149
-
150
-
151
-
152
-
153
-
154
-
155
-
156
-
157
-
158
-
159
-
160
-
161
-
162
-
163
-
164
 |
 |

31 December 2009
NOTES TO FINANCIAL STATEMENTS 財務報表附註
HAIER ELECTRONICS GROUP CO., LTD ANNUAL REPORT 2009
118
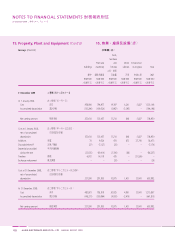
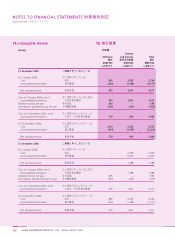
15. Property, Plant and Equipment (Cont’d)
Group (Cont’d)
Tools,
furniture
Plant and and Motor Construction
Buildings machinery fixtures vehicles in progress Total
RMB’000 RMB’000 RMB’000 RMB’000 RMB’000 RMB’000
31 December 2008 年
At 1 January 2008:
Cost 478,906 794,977 19,197 4,241 5,827 1,303,148
Accumulated depreciation (125,296 ) (459,520 ) (5,987 ) (3,395 ) – (594,198 )
Net carrying amount 353,610 335,457 13,210 846 5,827 708,950
Cost at 1 January 2008,
net of accumulated
depreciation 353,610 335,457 13,210 846 5,827 708,950
Additions 70 9,520 470 673 27,740 38,473
Disposals/write-off (27 ) (7,127 ) (20 ) – – (7,174 )
Depreciation provided
during the year (23,035 ) (60,014 ) (3,100 ) (88 ) – (86,237 )
Transfers 6,972 14,119 435 – (21,526 ) –
Exchange realignment – – (20 ) – – (20 )
Cost at 31 December 2008,
net of accumulated
depreciation 337,590 291,955 10,975 1,431 12,041 653,992
At 31 December 2008:
Cost 485,921 792,919 20,025 4,901 12,041 1,315,807
Accumulated depreciation (148,331 ) (500,964 ) (9,050 ) (3,470 ) – (661,815 )
Net carrying amount 337,590 291,955 10,975 1,431 12,041 653,992
15.