Haier 2009 Annual Report Download - page 119
Download and view the complete annual report
Please find page 119 of the 2009 Haier annual report below. You can navigate through the pages in the report by either clicking on the pages listed below, or by using the keyword search tool below to find specific information within the annual report.-
 1
1 -
2
-
3
-
4
-
5
-
6
-
7
-
8
-
9
-
10
-
11
-
12
-
13
-
14
-
15
-
16
-
17
-
18
-
19
-
20
-
21
-
22
-
23
-
24
-
25
-
26
-
27
-
28
-
29
-
30
-
31
-
32
-
33
-
34
-
35
-
36
-
37
-
38
-
39
-
40
-
41
-
42
-
43
-
44
-
45
-
46
-
47
-
48
-
49
-
50
-
51
-
52
-
53
-
54
-
55
-
56
-
57
-
58
-
59
-
60
-
61
-
62
-
63
-
64
-
65
-
66
-
67
-
68
-
69
-
70
-
71
-
72
-
73
-
74
-
75
-
76
-
77
-
78
-
79
-
80
-
81
-
82
-
83
-
84
-
85
-
86
-
87
-
88
-
89
-
90
-
91
-
92
-
93
-
94
-
95
-
96
-
97
-
98
-
99
-
100
-
101
-
102
-
103
-
104
-
105
-
106
-
107
-
108
-
 109
109 -
 110
110 -
 111
111 -
 112
112 -
 113
113 -
 114
114 -
 115
115 -
 116
116 -
 117
117 -
 118
118 -
 119
119 -
 120
120 -
 121
121 -
 122
122 -
 123
123 -
 124
124 -
 125
125 -
 126
126 -
 127
127 -
 128
128 -
 129
129 -
130
-
131
-
132
-
133
-
134
-
135
-
136
-
137
-
138
-
139
-
140
-
141
-
142
-
143
-
144
-
145
-
146
-
147
-
148
-
149
-
150
-
151
-
152
-
153
-
154
-
155
-
156
-
157
-
158
-
159
-
160
-
161
-
162
-
163
-
164
 |
 |

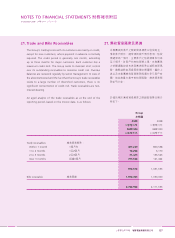
31 December 2009
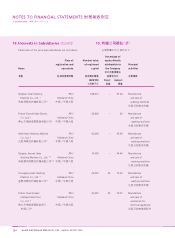
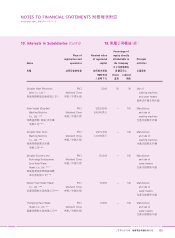
NOTES TO FINANCIAL STATEMENTS 財務報表附註
海爾電器集團有限公司 117
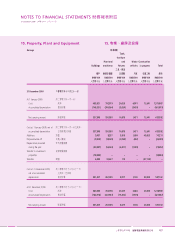
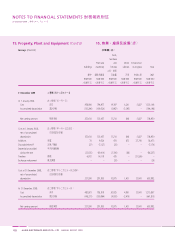
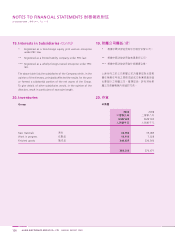
15. Property, Plant and Equipment
Group
Tools,
furniture
Plant and and Motor Construction
Buildings machinery fixtures vehicles in progress Total
RMB’000 RMB’000 RMB’000 RMB’000 RMB’000 RMB’000
31 December 2009 年
At 1 January 2009:
Cost 485,921 792,919 20,025 4,901 12,041 1,315,807
Accumulated depreciation (148,331 ) (500,964 ) (9,050 ) (3,470 ) – (661,815 )
Net carrying amount 337,590 291,955 10,975 1,431 12,041 653,992
Cost at 1 January 2009, net of
accumulated depreciation 337,590 291,955 10,975 1,431 12,041 653,992
Additions 5,437 8,237 5,815 1,099 49,623 70,211
Disposals/write-off (9,029 ) (18,520 ) (2,054 ) (402 ) – (30,005 )
Depreciation provided
during the year (20,087 ) (50,524 ) (6,571 ) (1,020 ) – (78,202 )
Transfer to investment
properties (18,894 ) – – – – (18,894 )
Transfers 6,390 30,637 112 – (37,139 ) –
Cost at 31 December 2009,
net of accumulated
depreciation 301,407 261,785 8,277 1,108 24,525 597,102
At 31 December 2009:
Cost 464,383 703,746 23,629 2,686 24,525 1,218,969
Accumulated depreciation (162,976 ) (441,961 ) (15,352 ) (1,578 ) – (621,867 )
Net carrying amount 301,407 261,785 8,277 1,108 24,525 597,102
15.