Haier 2009 Annual Report Download - page 144
Download and view the complete annual report
Please find page 144 of the 2009 Haier annual report below. You can navigate through the pages in the report by either clicking on the pages listed below, or by using the keyword search tool below to find specific information within the annual report.-
 1
1 -
2
-
3
-
4
-
5
-
6
-
7
-
8
-
9
-
10
-
11
-
12
-
13
-
14
-
15
-
16
-
17
-
18
-
19
-
20
-
21
-
22
-
23
-
24
-
25
-
26
-
27
-
28
-
29
-
30
-
31
-
32
-
33
-
34
-
35
-
36
-
37
-
38
-
39
-
40
-
41
-
42
-
43
-
44
-
45
-
46
-
47
-
48
-
49
-
50
-
51
-
52
-
53
-
54
-
55
-
56
-
57
-
58
-
59
-
60
-
61
-
62
-
63
-
64
-
65
-
66
-
67
-
68
-
69
-
70
-
71
-
72
-
73
-
74
-
75
-
76
-
77
-
78
-
79
-
80
-
81
-
82
-
83
-
84
-
85
-
86
-
87
-
88
-
89
-
90
-
91
-
92
-
93
-
94
-
95
-
96
-
97
-
98
-
99
-
100
-
101
-
102
-
103
-
104
-
105
-
106
-
107
-
108
-
109
-
110
-
111
-
112
-
113
-
114
-
115
-
116
-
117
-
118
-
119
-
120
-
121
-
122
-
123
-
124
-
125
-
126
-
127
-
128
-
129
-
130
-
131
-
132
-
133
-
 134
134 -
 135
135 -
 136
136 -
 137
137 -
 138
138 -
 139
139 -
 140
140 -
 141
141 -
 142
142 -
 143
143 -
 144
144 -
 145
145 -
 146
146 -
 147
147 -
 148
148 -
 149
149 -
 150
150 -
 151
151 -
 152
152 -
 153
153 -
 154
154 -
155
-
156
-
157
-
158
-
159
-
160
-
161
-
162
-
163
-
164
 |
 |

31 December 2009
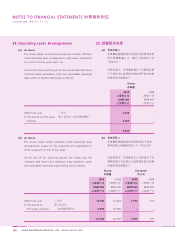
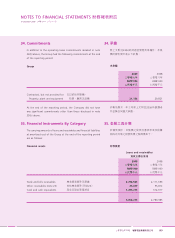
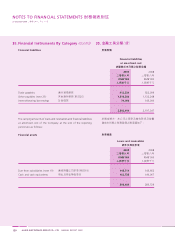
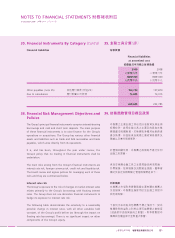
NOTES TO FINANCIAL STATEMENTS 財務報表附註
HAIER ELECTRONICS GROUP CO., LTD ANNUAL REPORT 2009
142
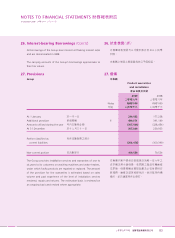
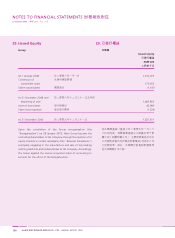
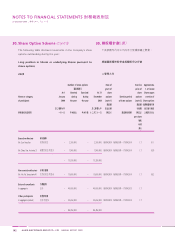
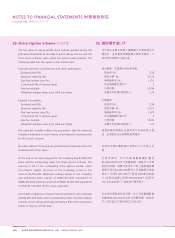
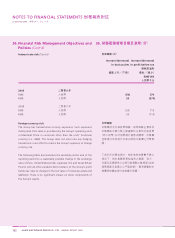
Number of share options Date of Exercise Approximate
grant of price of % of issued
At 1 Granted Exercised At 31 share share Shares upon
Name or category January during during December options Exercise period options exercise of
of participant 2009 the year the year 2009 (note 1) of share options (note 2) Share options
年 年
年 年 1 2
per share
HK$
Executive directors
Mr. Sun Jing Yan – 2,300,000 – 2,300,000 18/09/2009 18/09/2009 – 17/09/2014 1.7 0.11
Mr. Zhou Yun Jie (note 3) 3 – 7,900,000 – 7,900,000 18/09/2009 18/09/2009 – 17/09/2014 1.7 0.39
– 10,200,000 – 10,200,000
Non-executive directors
Mr. Wu Ke Song (note 4) 4 – 10,600,000 – 10,600,000 18/09/2009 18/09/2009 – 17/09/2014 1.7 0.52
External consultants
In aggregate – 40,000,000 – 40,000,000 18/09/2009 18/09/2009 – 17/09/2013 1.7
Other participants
In aggregate (note 5) 5 – 23,650,000 – 23,650,000 18/09/2009 18/09/2009 – 17/09/2014 1.7
– 84,450,000 – 84,450,000
30.
年
30. Share Option Scheme (Cont’d)
The following table discloses movements in the Company’s share
options outstanding during the year:
Long position in Shares or underlying Shares pursuant to
share options
2009