Haier 2009 Annual Report Download - page 102
Download and view the complete annual report
Please find page 102 of the 2009 Haier annual report below. You can navigate through the pages in the report by either clicking on the pages listed below, or by using the keyword search tool below to find specific information within the annual report.-
 1
1 -
2
-
3
-
4
-
5
-
6
-
7
-
8
-
9
-
10
-
11
-
12
-
13
-
14
-
15
-
16
-
17
-
18
-
19
-
20
-
21
-
22
-
23
-
24
-
25
-
26
-
27
-
28
-
29
-
30
-
31
-
32
-
33
-
34
-
35
-
36
-
37
-
38
-
39
-
40
-
41
-
42
-
43
-
44
-
45
-
46
-
47
-
48
-
49
-
50
-
51
-
52
-
53
-
54
-
55
-
56
-
57
-
58
-
59
-
60
-
61
-
62
-
63
-
64
-
65
-
66
-
67
-
68
-
69
-
70
-
71
-
72
-
73
-
74
-
75
-
76
-
77
-
78
-
79
-
80
-
81
-
82
-
83
-
84
-
85
-
86
-
87
-
88
-
89
-
90
-
91
-
 92
92 -
 93
93 -
 94
94 -
 95
95 -
 96
96 -
 97
97 -
 98
98 -
 99
99 -
 100
100 -
 101
101 -
 102
102 -
 103
103 -
 104
104 -
 105
105 -
 106
106 -
 107
107 -
 108
108 -
 109
109 -
 110
110 -
 111
111 -
 112
112 -
113
-
114
-
115
-
116
-
117
-
118
-
119
-
120
-
121
-
122
-
123
-
124
-
125
-
126
-
127
-
128
-
129
-
130
-
131
-
132
-
133
-
134
-
135
-
136
-
137
-
138
-
139
-
140
-
141
-
142
-
143
-
144
-
145
-
146
-
147
-
148
-
149
-
150
-
151
-
152
-
153
-
154
-
155
-
156
-
157
-
158
-
159
-
160
-
161
-
162
-
163
-
164
 |
 |
31 December 2009
NOTES TO FINANCIAL STATEMENTS 財務報表附註
HAIER ELECTRONICS GROUP CO., LTD ANNUAL REPORT 2009
100
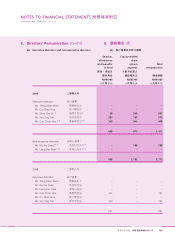
4. Operating Segment Information (Cont’d)
Geographical information
(a) All of the Group’s revenue is derived from customers based
in Mainland China.
(b) Non-current assets
4.
(a)
(b)
2009 2008
年
RMB’000 RMB’000
Mainland China 685,465 726,280
Hong Kong 74 177
685,539 726,457
The non-current asset information above is based on the
location of assets and excludes deferred tax assets.
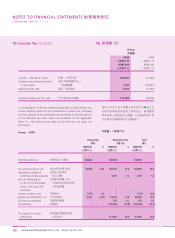
Information about major customers
There were three customers which individually accounted for
10% or more of the Group’s revenue during the year, and their
respective sales amounts were approximately RMB5,473,089,000,
RMB1,638,376,000 and RMB1,256,986,000.
There were four customers which accounted for 10% or more
of the Group’s revenue in the previous year, and their respective
sales amounts were approximately RMB3,379,448,000,
RMB2,128,225,000, RMB1,377,858,000 and RMB996,201,000.
The sales to the above customers are included in the washing
machine business segment and water heater business segment.
有關主要客戶資料
10%
5,473,089,0001,638,376,000
1,256,986,000
10%
3,379,448,0002,128,225,000
1,377,858,000 996,201,000