HTC 2014 Annual Report Download - page 87
Download and view the complete annual report
Please find page 87 of the 2014 HTC annual report below. You can navigate through the pages in the report by either clicking on the pages listed below, or by using the keyword search tool below to find specific information within the annual report.-
 1
1 -
2
-
3
-
4
-
5
-
6
-
7
-
8
-
9
-
10
-
11
-
12
-
13
-
14
-
15
-
16
-
17
-
18
-
19
-
20
-
21
-
22
-
23
-
24
-
25
-
26
-
27
-
28
-
29
-
30
-
31
-
32
-
33
-
34
-
35
-
36
-
37
-
38
-
39
-
40
-
41
-
42
-
43
-
44
-
45
-
46
-
47
-
48
-
49
-
50
-
51
-
52
-
53
-
54
-
55
-
56
-
57
-
58
-
59
-
60
-
61
-
62
-
63
-
64
-
65
-
66
-
67
-
68
-
69
-
70
-
71
-
72
-
73
-
74
-
75
-
76
-
 77
77 -
 78
78 -
 79
79 -
 80
80 -
 81
81 -
 82
82 -
 83
83 -
 84
84 -
 85
85 -
 86
86 -
 87
87 -
 88
88 -
 89
89 -
 90
90 -
 91
91 -
 92
92 -
 93
93 -
 94
94 -
 95
95 -
 96
96 -
 97
97 -
98
-
99
-
100
-
101
-
102
-
103
-
104
-
105
-
106
-
107
-
108
-
109
-
110
-
111
-
112
-
113
-
114
-
115
-
116
-
117
-
118
-
119
-
120
-
121
-
122
-
123
-
124
-
125
-
126
-
127
-
128
-
129
-
130
-
131
-
132
-
133
-
134
-
135
-
136
-
137
-
138
-
139
-
140
-
141
-
142
-
143
-
144
 |
 |

• Financial information Financial information •
170 171
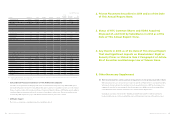
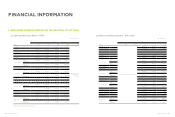
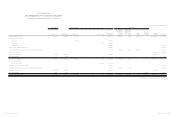
(3) Consolidated Financial Analysis - IFRS
Item
Year As of
2015.03.31
2014 2013 2012 2011 2010
Capital Structure
Analysis
Debt Ratio(%) 51 55 61
Financial analysis was based
on ROC GAAP
52
Long-term Fund to Fixed Assets Ratio(%) 343 304 309 349
Liquidity Analysis
Current Ratio(%) 132 118 108 133
Quick Ratio(%) 104 87 85 101
Debt Services Coverage Ratio(%) 118 (22) 11,347 346
Operating
Performance
Analysis
Average Collection Turnover(Times)6.41 5.83 5.27 4.87
Days Sales Outstanding 57 63 69 75
Average Inventory Turnover(Times)6.34 5.81 6.96 6.25
Average Payment Turnover(Times)3.27 2.69 2.84 2.91
Average Inventory Turnover Days 58 63 52 58
Fixed Assets Turnover(Times)8.02 7.96 11.12 1.82
Total Assets Turnover(Times)1.15 1.18 1.39 0.25
Profitability
Analysis
Return on Total Assets(%) 0.88 (0.69) 7.61 0.22
Return on Equity(%) 1.88 (1.68) 19.3 0.45
Ratio of income before tax to paid-in capital
(%) 23.75 (2.32) 228.37 6.21
Net Margin(%) 0.79 (0.65) 6.1 0.87
Basic Earnings Per Share(NT$)1.80 (1.60) 20.21 0.43
Cash Flow
Cash Flow Ratio(%) (0.41) (17.17) 18.69 (2.77)
Cash Flow Adequacy Ratio(%) 105.69 109.71 126.39 101.45
Cash Flow Reinvestment Ratio(%) (0.36) (19.78) (10.66) (2.50)
Leverage
Operating Leverage 37.00 (5.87) 2.37 259.23
Financial Leverage 1 1 1 1
1. Capital Structure & Liquidity Analyses
As of year-end 2014, our debt ratio stood at 51%, slightly lower than the 2013 level and current and quick ratios were
both lower at 132% and 104%, respectively. This was because the weight of decrease in current and quick ratio for
2014 was lower than that in current liabilities. The long-term funds to fixed asset ratio for 2014 increased to 343%
compared to 2013 due to profiting from loss with increased equity.
2. Operating Performance Analysis
Compared to the previous year, total asset turnover decreased because of a decrease in operating income. As no fixed
asset of a large amount was purchased for this year and continued to recognized depreciation, the decrease in total
amount of fixed asset caused the increase in fixed asset turnover compared to the previous year. Collection turnover
increased compared to the previous year due to normal receipt of account receivables and extent of decrease in
account receivables amount more than that in operating income. Moreover, operating cost decreased in response to
decrease in operating income. Given the extent of decrease in inventory and account payable that is larger than that
in operating cost, both the turnover of inventory and payable rose compared to the previous year.
3. Profitability Analysis
Though experiencing decrease in revenue for 2014 due to competition in international markets, HTC managed to
profit in 2014 from loss with effective control on operating costs and savings on operating expenses. Profitability ratio
rose compared to the previous year with $1.80 for basic earnings per share.
4. Cash Flow Analysis
In 2014, HTC managed to profit from loss with a good inventory management and end-term receipt of cash for its
account receivables. Net cash flow from operating activities outflow decreased while both cash flow ratio and cash
reinvestment ratio turned positive. Cash flow adequacy ratio decreased to 105.69% compared to 2013 because of
decrease in cash flow in 2014 from the operating activities for the last five years.
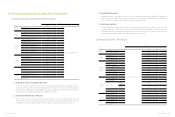
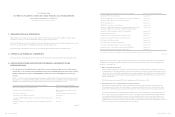
(4) Consolidated Financial Analysis – ROC GAAP
Item (Note 1)
Year
2014 2013 2012 2011 2010
Capital
Structure
Analysis
Debt Ratio(%)
Financial analysis was based on IFRS
61 60 61
Long-term Fund to Fixed Assets Ratio(%) 313 476 533
Liquidity
Analysis
Current Ratio(%) 111 126 146
Quick Ratio(%) 85 102 120
Debt Services Coverage Ratio(%) 11,342 2,307 12,624
Operating
Performance
Analysis
Average Collection Turnover(Times)5.27 7.23 6.14
Days Sales Outstanding 69 50 59
Average Inventory Turnover(Times)6.96 10.55 10.06
Average Payment Turnover(Times)2.79 4.66 4.35
Average Inventory Turnover Days 52 35 36
Fixed Assets Turnover(Times)11.27 21.65 19.88
Total Assets Turnover(Times)1.40 1.82 1.46
Profitability
Analysis
Return on Total Assets(%) 8 28 26
Return on Equity(%) 19 70 56
Paid-in Capital Ratio(%)
Operating
Income 221 807 540
Pre-tax
Income 228 838 550
Net Margin(%) 6 13 14
Basic Earnings Per Share(NT$)20.17 73.32 46.18
Cash Flow
Cash Flow Ratio(%) 18 58 40
Cash Flow Adequacy Ratio(%) 126 158 150
Cash Flow Reinvestment Ratio(%) (11) 53 32
Leverage
Operating Leverage 2.37 1.35 1.43
Financial Leverage 1 1 1
Note 1: Glossary
a. Financial Structure
(1) Debt Ratio =Total Liabilities / Total Assets.
(2) Ratio of Long-Term Capital To Property, Plant And Equipment =
(Total Equity + Non-Current Liabilities) / Net Worth of Property,
Plant And Equipment
b. Solvency
(1) Current Ratio =Current Assets / Current Liabilities.
(2) Quick Ratio =(Current Assets - Inventories - Prepaid Expenses) /
Current Liabilities.
(3) Interest Coverage Ratio = Income before Income Tax And Interest
Expenses / Current Interest Expenses
c. Operating ability
(1) Receivables (including accounts receivable and notes receivable
arising from business oeprations) turnover rate = net sales / average
receivables (including accounts receivable and notes receivable
arising from business operations) for each period
(2) Days Sales Outstanding =365 / Average Collection Turnover.
(3) Average Inventory Turnover =Cost of Sales / Average Inventory.
(4) Payables (Including Accounts Payable and Notes Payable Arising
from Business Operations) Turnover Rate = Cost of Sale / Average
Payables (Including Accounts Payable and Notes Payable Arising
from Business Operations) For Each Period
(5) Average Inventory Turnover Days =365 / Average Inventory Turnover.
(6) Property, Plant and Equipment Turnover Rate = Net Sales / Average Net Worth of
Property, Plant and Equipment
(7) Total Asset Turnover Rate = Net Sales / Average Total Assets
d. Profitability
(1) Return on Total Assets =(Net Income + Interest Expenses * (1 - Effective Tax Rate)
) / Average Total Assets.
(2) Return on Equity =Net Income / Average Total Equity.
(3) Profit Margin before Tax = Net Income / Net Sales
(4) Earnings per Share = (Profit And Loss Attributable to Owners of the Parent –
Dividends on Preferred Shares) / Weighted Average Number of Issued Shares
e. Cash Flow
(1) Cash Flow Ratio =Net Cash Provided by Operating Activities / Current Liabilities.
(2) Net Cash Flow Adequacy Ratio = Net Cash Flow from Operating Activities for
the Most Recent Five Years / (Capital Expenditures + Inventory Increase + Cash
Dividend) Additions, and Cash Dividend.
(3) Cash Flow Reinvestment Ratio = (Net Cash Flow from Operating Activities – Cash
Dividend) / Gross Property, Plant and Equipment Value + Long-Term Investment +
Other Non-Current Assets + Working Capital)
f. Leverage
(1) Operating Leverage = (Net Operating Revenue – Variable Operating Costs and
Expenses) / Operating Income
(2) Financial Leverage = Operating Income / (Operating Income / Interest Expenses)