HTC 2014 Annual Report Download - page 85
Download and view the complete annual report
Please find page 85 of the 2014 HTC annual report below. You can navigate through the pages in the report by either clicking on the pages listed below, or by using the keyword search tool below to find specific information within the annual report.-
 1
1 -
2
-
3
-
4
-
5
-
6
-
7
-
8
-
9
-
10
-
11
-
12
-
13
-
14
-
15
-
16
-
17
-
18
-
19
-
20
-
21
-
22
-
23
-
24
-
25
-
26
-
27
-
28
-
29
-
30
-
31
-
32
-
33
-
34
-
35
-
36
-
37
-
38
-
39
-
40
-
41
-
42
-
43
-
44
-
45
-
46
-
47
-
48
-
49
-
50
-
51
-
52
-
53
-
54
-
55
-
56
-
57
-
58
-
59
-
60
-
61
-
62
-
63
-
64
-
65
-
66
-
67
-
68
-
69
-
70
-
71
-
72
-
73
-
74
-
 75
75 -
 76
76 -
 77
77 -
 78
78 -
 79
79 -
 80
80 -
 81
81 -
 82
82 -
 83
83 -
 84
84 -
 85
85 -
 86
86 -
 87
87 -
 88
88 -
 89
89 -
 90
90 -
 91
91 -
 92
92 -
 93
93 -
 94
94 -
 95
95 -
96
-
97
-
98
-
99
-
100
-
101
-
102
-
103
-
104
-
105
-
106
-
107
-
108
-
109
-
110
-
111
-
112
-
113
-
114
-
115
-
116
-
117
-
118
-
119
-
120
-
121
-
122
-
123
-
124
-
125
-
126
-
127
-
128
-
129
-
130
-
131
-
132
-
133
-
134
-
135
-
136
-
137
-
138
-
139
-
140
-
141
-
142
-
143
-
144
 |
 |

• Financial information Financial information •
166 167
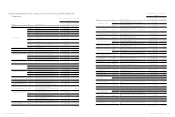
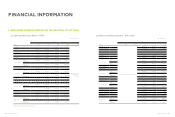
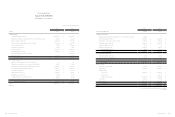
2. Abbreviated Income Statements for the Past Five Fiscal Years
(1) Abbreviated Income Statement – IFRS
Unit:NT$ thousands
Item
Year
2014 2013 2012 2011 2010
Revenues 174,793,564 194,294,044 270,701,687
Abbreviated income statement was based on
ROC GAAP
Gross Profit 31,264,301 33,969,488 56,994,793
Operating Loss 481,485 (1,636,453) 14,770,387
Non-operating Income and Expenses 1,049,730 351,246 2,162,323
Net Income (Loss) Before Tax 1,531,215 (1,285,207) 16,932,710
Net Income (Loss) from Continuing
Operations 1,483,046 (1,323,785) 16,813,575
Non-Continuing Operations Loss - - -
Net (Loss) Income 1,483,046 (1,323,785) 16,813,575
Other Comprehensive Income For The
Year –Net Of Income Tax 873,654 1,428,310 (893,331)
Total Comprehensive Income For The
Year 2,356,700 104,525 15,920,244
Basic Earnings (Loss) Per Share 1.80 (1.60) 20.21
(2) Abbreviated Income Statement – ROC GAAP
Unit:NT$ thousands
Item
Year
2014 2013 2012 2011 2010
Revenues
Abbreviated income statement was based on
IFRS
270,701,687 455,079,186 275,046,954
Gross Profit 56,989,072 119,754,046 79,556,972
Operating Income 14,762,895 64,860,542 42,295,343
Non-operating Income and Gains 2,317,531 5,060,293 2,536,080
Non-operating Expenses and Losses 155,323 71,164 340,114
Income from Continuing Operation
before Income Tax 16,925,103 69,849,671 44,491,309
Income from Continuing Operations 16,780,968 61,975,796 39,533,600
Income (Loss) from Discontinued
Operations ---
Income (Loss) from Extraordinary
Items ---
Cumulative Effect of Changes in
Accounting Principle ---
Net Income 16,780,968 61,975,796 39,533,600
Basic Earnings Per Share 20.17 73.32 46.18
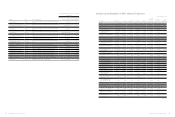
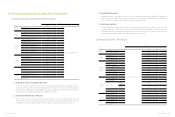
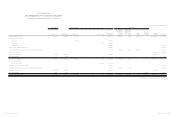
(3) Abbreviated Consolidated Income Statement – IFRS
Item
Year
As of 2015.03.312014 2013 2012 2011 2010
Revenue 187,911,200 203,402,648 289,020,175
Abbreviated consolidated income
statement was based on ROC GAAP
41,524,272
Gross Profit 40,755,095 42,270,753 72,930,849 8,162,771
Operating Income (Loss) 668,770 (3,970,522) 18,827,314 20,473
Non-operating Income and Expenses 1,314,656 3,774,878 630,751 493,782
Net Income (Loss) Before Tax 1,983,426 (195,644) 19,458,065 514,255
Net Income (Loss) from Continuing Operations 1,483,046 (1,323,785) 17,621,793 360,057
Non-Continuing Operations Loss - - - -
Net Income (Loss) 1,483,046 (1,323,785) 17,621,793 360,057
Other Comprehensive Income and Loss for the Period,
Net of Income Tax 873,654 1,428,310 (893,331) (1,157,121)
Total Comprehensive Income for the Period 2,356,700 104,525 16,728,462 (797,064)
Allocations of Profit or Loss for the Period Attributable
to: Owners of the Parent 1,483,046 (1,323,785) 16,813,575 360,057
Allocations of Profit or Loss for the Period Attributable
to: Non-controlling Interest - - 808,218 -
Allocations of Total Comprehensive Income for the
Period Attributable to: Owners of the Parent 2,356,700 104,525 15,920,244 (797,064)
Allocations of Total Comprehensive Income for the
Period Attributable to: Non-controlling Interest - - 808,218 -
Basic Earnings (Loss) Per Share 1.80 (1.60) 20.21 0.43
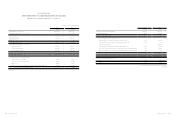
(4) Abbreviated Consolidated Income Statement – ROC GAAP
Unit:NT$ thousands
Item
Year
2014 2013 2012 2011 2010
Revenues
Abbreviated consolidated income statement
was based on IFRS
289,020,175 465,794,773 278,761,244
Gross Profit 72,925,077 131,797,527 83,868,739
Operating Income 18,819,707 68,787,767 44,132,581
Non-operating Income and Gains 2,240,310 2,783,264 1,142,944
Non-operating Expenses and Losses 1,609,559 147,344 311,137
Income from Continuing Operations Before Income Tax 19,450,458 71,423,687 44,964,388
Income from Continuing Operations After Tax 17,589,186 62,299,048 39,514,844
Income (Loss) from Discontinued Operations - - -
Income (Loss) from Extraordinary Items - - -
Cumulative Effect of Changes in Accounting Principle - - -
Net Income 17,589,186 62,299,048 39,514,844
Net Income Attribute to Shareholders of the Parent 16,780,968 61,975,796 39,533,600
Basic Earnings Per Share 20.17 73.32 46.18
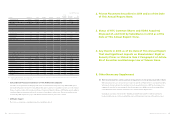
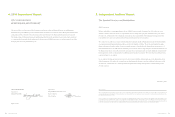
(5) The Name of the Certified Public Accountant and the Auditor's Opinion
Year CPA Firm Certified Public Accountant Auditor's Opinion
2010 Deloitte Touche Tohmatsu Ming-Hsien Yang and Tze-Chun Wang Unqualified Opinion
2011 Deloitte Touche Tohmatsu Ming-Hsien Yang and Tze-Chun Wang Unqualified Opinion
2012 Deloitte Touche Tohmatsu Ming-Hsien Yang and Tze-Chun Wang Unqualified Opinion
2013 Deloitte Touche Tohmatsu Ming-Hsien Yang and Wen-Ya Hsu Unqualified Opinion
2014 Deloitte Touche Tohmatsu Wen-Ya Hsu and Casey Lai Unqualified Opinion