HTC 2014 Annual Report Download - page 66
Download and view the complete annual report
Please find page 66 of the 2014 HTC annual report below. You can navigate through the pages in the report by either clicking on the pages listed below, or by using the keyword search tool below to find specific information within the annual report.-
 1
1 -
2
-
3
-
4
-
5
-
6
-
7
-
8
-
9
-
10
-
11
-
12
-
13
-
14
-
15
-
16
-
17
-
18
-
19
-
20
-
21
-
22
-
23
-
24
-
25
-
26
-
27
-
28
-
29
-
30
-
31
-
32
-
33
-
34
-
35
-
36
-
37
-
38
-
39
-
40
-
41
-
42
-
43
-
44
-
45
-
46
-
47
-
48
-
49
-
50
-
51
-
52
-
53
-
54
-
55
-
 56
56 -
 57
57 -
 58
58 -
 59
59 -
 60
60 -
 61
61 -
 62
62 -
 63
63 -
 64
64 -
 65
65 -
 66
66 -
 67
67 -
 68
68 -
 69
69 -
 70
70 -
 71
71 -
 72
72 -
 73
73 -
 74
74 -
 75
75 -
 76
76 -
77
-
78
-
79
-
80
-
81
-
82
-
83
-
84
-
85
-
86
-
87
-
88
-
89
-
90
-
91
-
92
-
93
-
94
-
95
-
96
-
97
-
98
-
99
-
100
-
101
-
102
-
103
-
104
-
105
-
106
-
107
-
108
-
109
-
110
-
111
-
112
-
113
-
114
-
115
-
116
-
117
-
118
-
119
-
120
-
121
-
122
-
123
-
124
-
125
-
126
-
127
-
128
-
129
-
130
-
131
-
132
-
133
-
134
-
135
-
136
-
137
-
138
-
139
-
140
-
141
-
142
-
143
-
144
 |
 |
• Financial status, operating results and risk management Financial status, operating results and risk management •
128 129
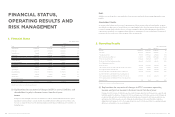
FINANCIAL STATUS,
OPERATING RESULTS AND
RISK MANAGEMENT
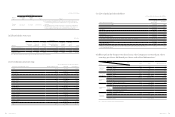
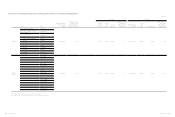
1. Financial Status
Unit:NT$ thousands
Item 2014 2013
Difference
Amount %
Current Assets 110,286,950 111,507,281 (1,220,331) (1)
Properties 23,435,556 25,561,399 (2,125,843) (8)
Intangible Assets 7,209,291 8,664,066 (1,454,775) (17)
Other Assets 22,906,477 26,896,441 (3,989,964) (15)
Total Assets 163,838,274 172,629,187 (8,790,913) (5)
Current Liabilities 83,258,739 94,513,990 (11,255,251) (12)
Non-current Liabilities 246,162 407,537 (161,375) (40)
Total Liabilities 83,504,901 94,921,527 (11,416,626) (12)
Capital Stock 8,349,521 8,423,505 (73,984) (1)
Capital Surplus 15,140,687 15,360,307 (219,620) (1)
Retained Earnings 59,531,103 66,286,308 (6,755,205) (10)
Other Equity 1,062,118 557,698 504,420 90
Treasury Stock (3,750,056) (12,920,158) 9,170,102 (71)
Non-Controlling Interest - - -
Total Stockholders' Equity 80,333,373 77,707,660 2,625,713 3
* All numbers above are based on consolidated financial statements.
(1) Explanations for any material changes in HTC's assets, liabilities, and
shareholders' equity in the most recent two fiscal years
Assets:
Compared to 2013, intangible assets decreased in 2014 as a result of continued amortization and recognized
impairment loss form no future economic benefits of goodwill for this term. Other assets for 2014 also saw a
decrease as compared to those for 2013, which was mainly caused by disposal of financial assets carried at cost
during this term.
Debt:
Liabilities decreased from 2013 to 2014, mainly due to lower revenues and related reductions in purchasing and accounts
payables.
Shareholders' Equity:
As treasury stocks for this period were retired, carrying amount of these treasury stocks and capital surplus - premium
were debited according to ratios of equity. Differences in capital surplus for the debited treasury stocks were also debited
to retained earnings, which resulted in decrease of retained earnings for this year. Other adjustments to shareholders'
equity increased mainly due to recognizing exchange differences on translation of overseas subsidiaries. The amount of
treasury stocks decreased because of the retirement of these treasury stocks.
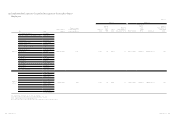
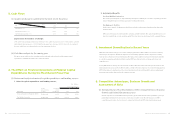
2. Operating Results
Unit:NT$ thousands
Item 2014 2013 Difference %
Revenues 187,911,200 203,402,648 (15,491,448) (8)
Gross Profit 40,755,095 42,270,753 (1,515,658) (4)
Operating (Loss) Profit 668,770 (3,970,522) 4,639,292 (117)
Non-operating Income and Expenses 1,314,656 3,774,878 (2,460,222) (65)
Net Income (Loss) Before Tax 1,983,426 (195,644) 2,179,070 (1,114)
Net Income (Loss) From Continuing Operations 1,483,046 (1,323,785) 2,806,831 (212)
Non-Continuing Operations Loss - - - -
Net Income (Loss) 1,483,046 (1,323,785) 2,806,831 (212)
Other Comprehensive Income And Loss For The Year, Net of Income Tax 873,654 1,428,310 (554,656) (39)
Total Comprehensive Income For The Year 2,356,700 104,525 2,252,175 2,155
(Loss) Profit For The Year Attributable To Owners Of The Parent 1,483,046 (1,323,785) 2,806,831 (212)
(Loss) Profit For The Year Attributable To Non-Controlling Interest - - - -
Total Comprehensive Income Attributable To Owners Of the Parent 2,356,700 104,525 2,252,175 2,155
Total Comprehensive Income Attributable To Non-Controlling Interest - - - -
Earnings Per Share 1.80 (1.60) 3.40 (213)
* All numbers above are based on consolidated financial statements.
(1) Explanations for any material changes in HTC's revenues, operating
income, and pre-tax income in the most recent two fiscal years
Compared to 2013, revenues for 2014 decreased as a result of changes in product portfolio and over-competition in
worldwide market for cellphones. Compared to 2013, operating income for 2014 increased as a result of changes in
product portfolio and enforced control that reduced related expenses. Compared to 2013, non-operation income
and expenses for 2014 decreased as a result of disposal of residual shares of Associates that did not take place
during this term. Compared to 2013, other comprehensive income for 2014 decreased due to recognizing exchange
differences on translation of overseas subsidiaries.