HTC 2014 Annual Report Download - page 58
Download and view the complete annual report
Please find page 58 of the 2014 HTC annual report below. You can navigate through the pages in the report by either clicking on the pages listed below, or by using the keyword search tool below to find specific information within the annual report.-
 1
1 -
2
-
3
-
4
-
5
-
6
-
7
-
8
-
9
-
10
-
11
-
12
-
13
-
14
-
15
-
16
-
17
-
18
-
19
-
20
-
21
-
22
-
23
-
24
-
25
-
26
-
27
-
28
-
29
-
30
-
31
-
32
-
33
-
34
-
35
-
36
-
37
-
38
-
39
-
40
-
41
-
42
-
43
-
44
-
45
-
46
-
47
-
 48
48 -
 49
49 -
 50
50 -
 51
51 -
 52
52 -
 53
53 -
 54
54 -
 55
55 -
 56
56 -
 57
57 -
 58
58 -
 59
59 -
 60
60 -
 61
61 -
 62
62 -
 63
63 -
 64
64 -
 65
65 -
 66
66 -
 67
67 -
 68
68 -
69
-
70
-
71
-
72
-
73
-
74
-
75
-
76
-
77
-
78
-
79
-
80
-
81
-
82
-
83
-
84
-
85
-
86
-
87
-
88
-
89
-
90
-
91
-
92
-
93
-
94
-
95
-
96
-
97
-
98
-
99
-
100
-
101
-
102
-
103
-
104
-
105
-
106
-
107
-
108
-
109
-
110
-
111
-
112
-
113
-
114
-
115
-
116
-
117
-
118
-
119
-
120
-
121
-
122
-
123
-
124
-
125
-
126
-
127
-
128
-
129
-
130
-
131
-
132
-
133
-
134
-
135
-
136
-
137
-
138
-
139
-
140
-
141
-
142
-
143
-
144
 |
 |
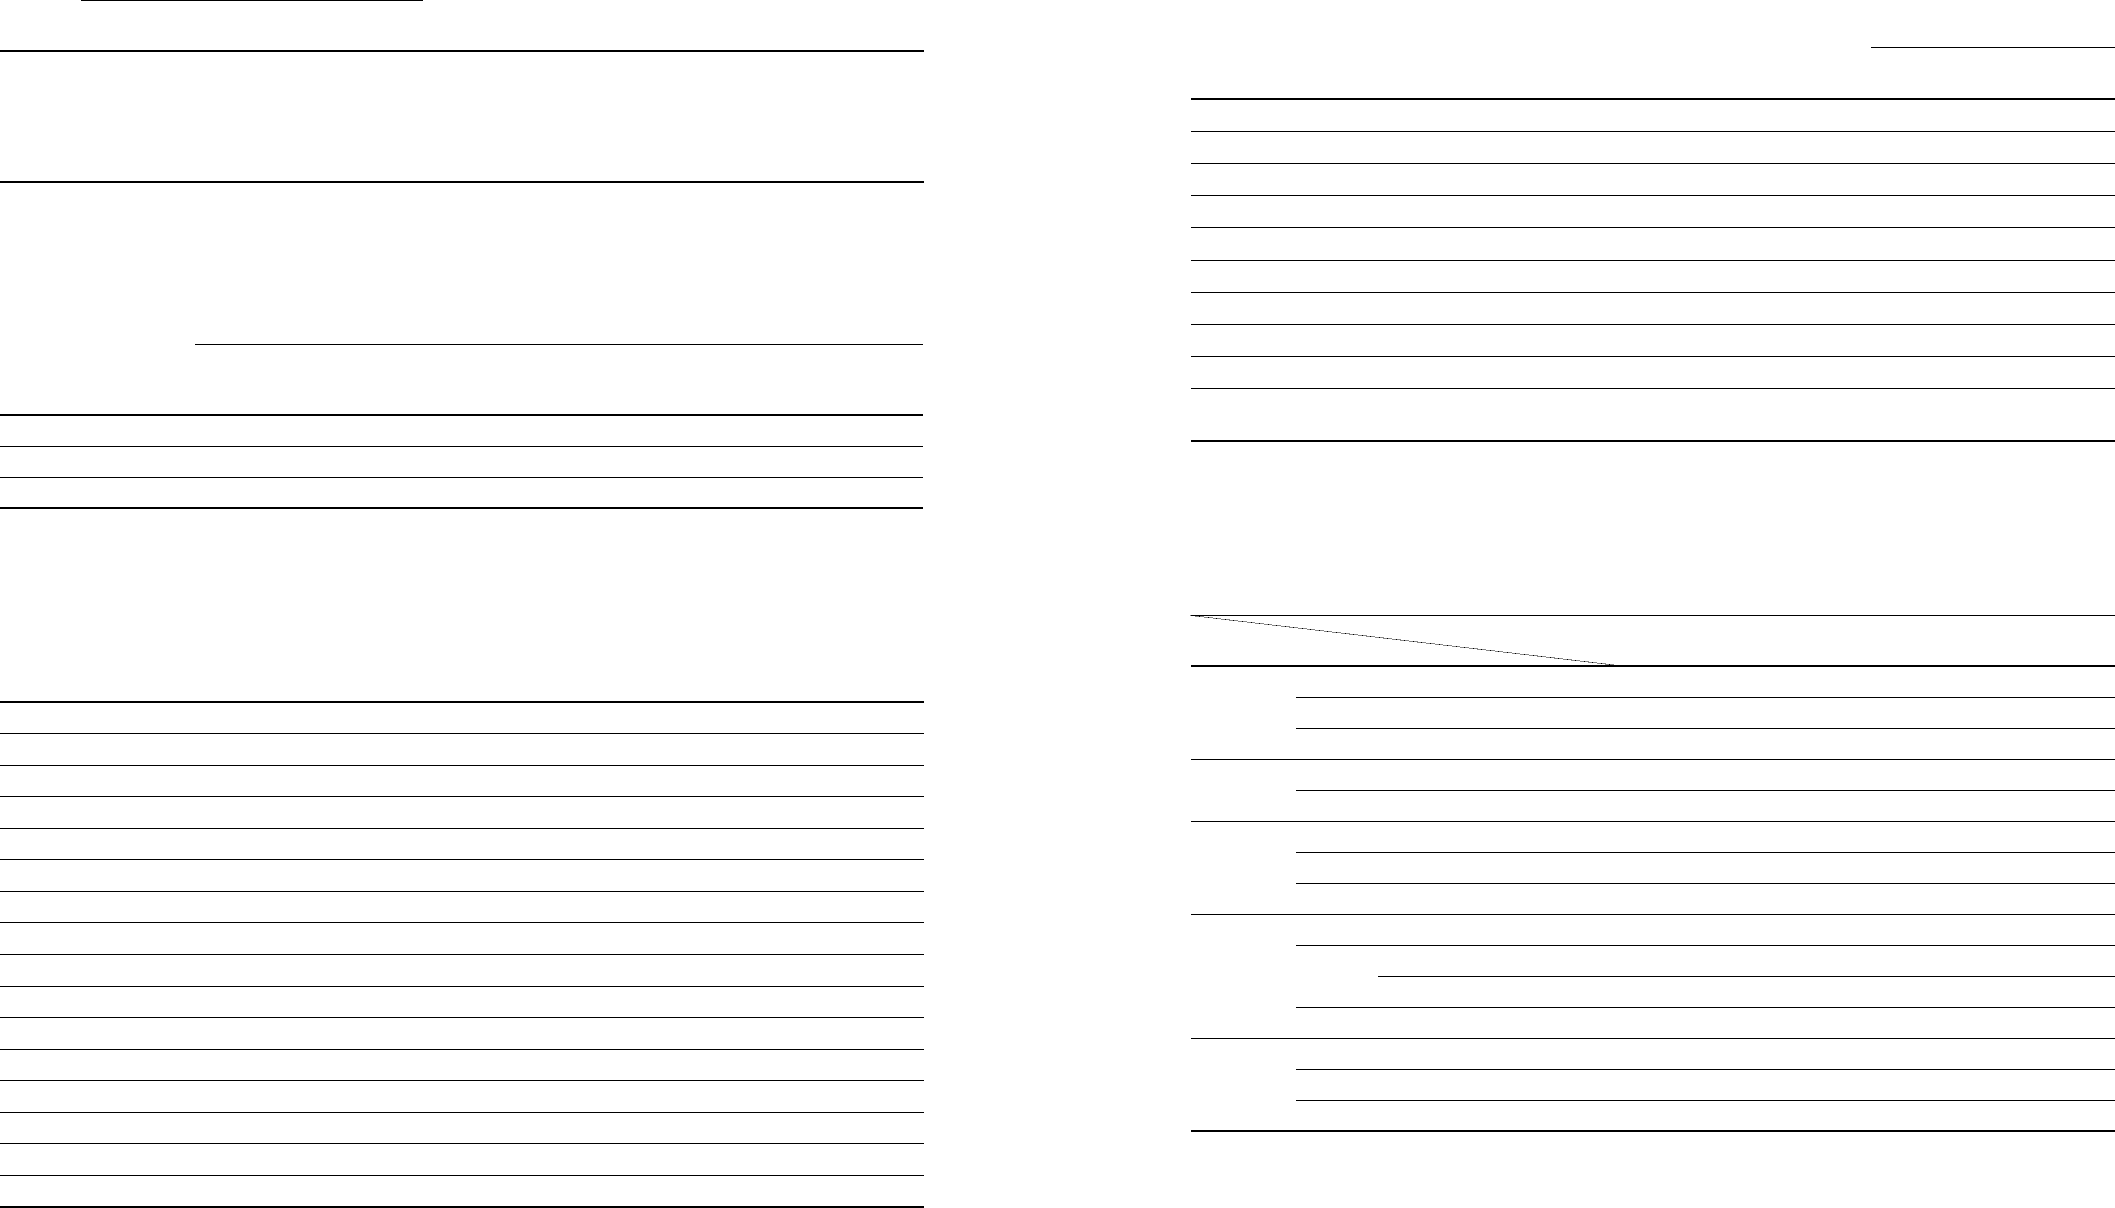
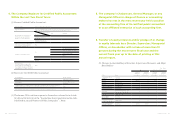
• Capital and shares Capital and shares •
112 113
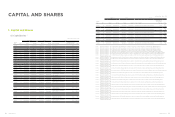
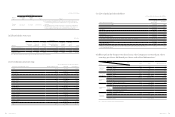
2015.04.04 Unit:Share
Type of
stock
Authorized Capital
Remark
Outstanding
shares
Unissued
Shares Total
Common
Stock 828,038,125 171,961,875 1,000,000,000
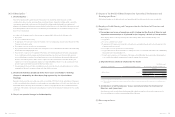
(1) Of our authorized capital, 50,000,000 shares are reserved for the exercise
of stock warrants, preferred shares with warrants, or corporate bonds with
warrants.
(2) The outstanding shares include 49,200 shares of treasury stock withdrawed
by HTC without compensation as the vesting conditions of the issuance of
restricted employee shares have not been met by the intend employee.
(2) Shareholder structure:
2015.04.04
Structure
Shareholder
Government
Agencies
Financial
Institutions
Other
Juridical
Persons
Foreign Institutions &
Natural Persons
Domestic
Natural
Persons
Treasury
stock
(Note) Total
Number of shareholders 1 29 390 769 134,444 1 135,634
Shareholding 14 14,802,471 145,384,510 187,640,634 480,161,296 49,200 828,038,125
Holding percentage 0.00% 1.79% 17.56% 22.66% 57.98% 0.01% 100.00%
Note: The treasury stocks were the restricted employee shares withdrawn by HTC without compensation.
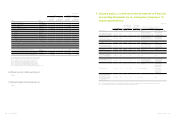
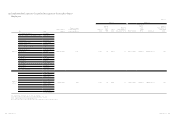
(3) Distribution of ownership:
2015.04.04 Each share has a par value of NT$10
Shareholder Ownership (Unit : share) Number of Shareholders Ownership Ownership (%)
1 ~ 999 23,961 3,404,357 0.41%
1,000 ~ 5,000 96,527 178,816,260 21.59%
5,001 ~ 10,000 8,776 67,057,761 8.10%
10,001 ~ 15,000 2,485 31,704,645 3.83%
15,001 ~ 20,000 1,300 23,838,878 2.88%
20,001 ~ 30,000 990 25,071,430 3.03%
30,001 ~ 40,000 428 15,240,739 1.84%
40,001 ~ 50,000 267 12,445,435 1.50%
50,001 ~ 100,000 461 32,531,153 3.93%
100,001 ~ 200,000 219 31,096,343 3.76%
200,001 ~ 400,000 102 27,777,849 3.35%
400,001 ~ 600,000 21 10,489,088 1.27%
600,001~ 800,000 21 14,725,082 1.78%
800,001 ~ 1,000,000 12 10,818,694 1.31%
Over 1,000,001 64 343,020,411 41.42%
Total 135,634 828,038,125 100.00%
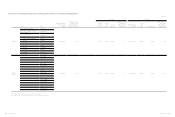
(4) List of principal shareholders:
2015.04.04 Each share has a par value of NT$10
Name of principal shareholders
Shares
Current
Shareholding Percentage
Way-Chih Investment Co., LTD. 43,819,290 5.29%
Way-Lien Technology Inc. 38,588,231 4.66%
Cher Wang 32,272,427 3.90%
Hon-Mou Investment Co., Ltd. 24,385,081 2.94%
Wen-Chi Chen 22,391,389 2.70%
GMO Emerging Markets Fund 14,781,000 1.79%
Standard Chartered Bank in custody for Vanguard Emerging Markets Stock Index Fund 13,782,925 1.66%
Kun Chang Investment Co, Ltd. 9,322,824 1.13%
VIA Technologies, Inc. 6,171,950 0.75%
JPMorgan Chase Bank N.A., Taipei Branch in custody for Vanguard Total International Stock Index Fund, a
series of Vanguard Star Funds
5,317,792 0.64%
(5) Share prices for the past two fiscal years, the Company's net worth per share,
earnings per share, dividends per share, and related information:
Year
Item 2013 2014 2015.01.01~2015.03.31
Market price
per share
Highest market price 307.5 180 161
Lowest market price 122 118 138
Average market price 208.42 140.01 149.55
Net worth per
share (Note)
Before distribution 94.37 97.02 96.24
After distribution 94.37 96.64 (Note) 95.86
Earnings per
share
Weighted average shares (thousand shares) 829,082 824,194 828,028
Earnings per share (1.60) 1.80 0.43
Retroactively adjusted earnings per share (1.60) 1.80 (Note) 0.43
Dividends per
share
Cash dividends 0 0.38 (Note)
Stock
dividends
Dividends from retained earnings 0 0 (Note)
Dividends from capital surplus - -
Accumulated undistributed dividend - -
Return on
investment
Price/Earnings ration N/A 77.78
Price/Dividend ratio N/A 368.45 (Note)
Cash dividend yield 0% 0.03% (Note)
Note :2015 pending on the approval of the Shareholders Meeting.