HTC 2014 Annual Report Download - page 83
Download and view the complete annual report
Please find page 83 of the 2014 HTC annual report below. You can navigate through the pages in the report by either clicking on the pages listed below, or by using the keyword search tool below to find specific information within the annual report.-
 1
1 -
2
-
3
-
4
-
5
-
6
-
7
-
8
-
9
-
10
-
11
-
12
-
13
-
14
-
15
-
16
-
17
-
18
-
19
-
20
-
21
-
22
-
23
-
24
-
25
-
26
-
27
-
28
-
29
-
30
-
31
-
32
-
33
-
34
-
35
-
36
-
37
-
38
-
39
-
40
-
41
-
42
-
43
-
44
-
45
-
46
-
47
-
48
-
49
-
50
-
51
-
52
-
53
-
54
-
55
-
56
-
57
-
58
-
59
-
60
-
61
-
62
-
63
-
64
-
65
-
66
-
67
-
68
-
69
-
70
-
71
-
72
-
 73
73 -
 74
74 -
 75
75 -
 76
76 -
 77
77 -
 78
78 -
 79
79 -
 80
80 -
 81
81 -
 82
82 -
 83
83 -
 84
84 -
 85
85 -
 86
86 -
 87
87 -
 88
88 -
 89
89 -
 90
90 -
 91
91 -
 92
92 -
 93
93 -
94
-
95
-
96
-
97
-
98
-
99
-
100
-
101
-
102
-
103
-
104
-
105
-
106
-
107
-
108
-
109
-
110
-
111
-
112
-
113
-
114
-
115
-
116
-
117
-
118
-
119
-
120
-
121
-
122
-
123
-
124
-
125
-
126
-
127
-
128
-
129
-
130
-
131
-
132
-
133
-
134
-
135
-
136
-
137
-
138
-
139
-
140
-
141
-
142
-
143
-
144
 |
 |

• Financial information Financial information •
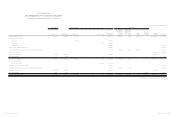
162 163
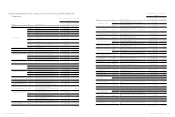
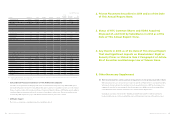
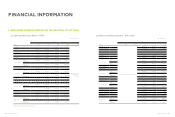
1. Abbreviated Balance Sheets for the Past Five Fiscal Years
(1) Abbreviated Balance Sheets - IFRS
Unit:NT$ thousands
Item
Year
2014 2013 2012 2011 2010
Current Assets 85,050,267 86,792,110 120,322,646 178,751,062
Abbreviated balance
sheet was based on
ROC GAAP
Properties 18,660,108 19,773,608 19,726,836 15,318,600
Intangible Assets 1,222,721 1,650,891 1,717,150 2,241,541
Other Assets 58,079,118 59,337,585 55,213,207 50,810,264
Total Assets 163,012,214 167,554,194 196,979,839 247,121,467
Current Liabilities
Before
Appropriation 82,556,301 89,731,340 116,556,611 145,631,489
After
Appropriation * 89,731,340 118,219,066 178,880,574
Non-current Liabilities 122,540 115,194 150,534 188,097
Total Liabilities
Before
Appropriation 82,678,841 89,846,534 116,707,145 145,819,586
After
Appropriation * 89,846,534 118,369,600 179,068,671
Capital Stock 8,349,521 8,423,505 8,520,521 8,520,521
Capital Surplus 15,140,687 15,360,307 16,601,557 16,601,557
Retained Earnings
Before
Appropriation 59,531,103 66,286,308 70,102,031 86,542,008
After
Appropriation * 66,286,308 68,439,576 53,292,923
Other Equity 1,062,118 557,698 (885,925) 2,939
Treasury Stock (3,750,056) (12,920,158) (14,065,490) (10,365,144)
Total Stockholders'
Equity
Before
Appropriation 80,333,373 77,707,660 80,272,694 101,301,881
After
Appropriation * 77,707,660 78,610,239 68,052,796
*:Subject to change after shareholders' meeting resolution
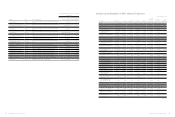
FINANCIAL INFORMATION
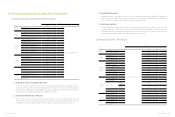
(2) Abbreviated Balance Sheets - ROC GAAP
Unit:NT$ thousands
Item
Year
2014 2013 2012 2011 2010
Current Assets
Abbreviated balance sheet was based on IFRS
127,271,142 180,204,464 156,875,067
Long-term Investments 42,652,154 37,777,785 10,708,420
Properties 19,935,586 15,422,345 10,941,230
Intangible Assets 1,625,340 2,120,948 208,581
Other Assets 12,702,516 12,585,381 5,317,155
Total Assets 199,186,738 284,110,923 184,050,453
Current Liabilities
Before
Appropriation 118,817,523 146,683,699 109,335,331
After
Appropriation 120,479,978 179,932,784 139,226,420
Long-term Liabilities - - -
Other Liabilities - 628 628
Total Liabilities
Before
Appropriation 118,817,523 146,684,327 109,335,959
After
Appropriation 120,479,978 179,933,412 139,227,048
Capital Stock 8,520,521 8,520,521 8,176,532
Capital Surplus 16,619,594 16,619,594 10,820,744
Retained Earnings
Before
Appropriation 70,148,728 86,616,845 63,105,566
After
Appropriation 68,486,273 53,367,760 32,855,543
Unrealized Loss on Financial Instruments 203,768 2,939 (885)
Cumulative Translation Adjustments (1,057,559) 32,134 (579,849)
Net Loss Not Recognized As Pension Cost (374) (293) (121)
Treasury Stock (14,065,490) (10,365,144) (6,852,493)
Total Stockholders'
Equity
Before
Appropriation 80,369,215 101,426,596 74,714,494
After
Appropriation 78,706,760 68,177,511 44,823,405