HTC 2014 Annual Report Download - page 128
Download and view the complete annual report
Please find page 128 of the 2014 HTC annual report below. You can navigate through the pages in the report by either clicking on the pages listed below, or by using the keyword search tool below to find specific information within the annual report.-
 1
1 -
2
-
3
-
4
-
5
-
6
-
7
-
8
-
9
-
10
-
11
-
12
-
13
-
14
-
15
-
16
-
17
-
18
-
19
-
20
-
21
-
22
-
23
-
24
-
25
-
26
-
27
-
28
-
29
-
30
-
31
-
32
-
33
-
34
-
35
-
36
-
37
-
38
-
39
-
40
-
41
-
42
-
43
-
44
-
45
-
46
-
47
-
48
-
49
-
50
-
51
-
52
-
53
-
54
-
55
-
56
-
57
-
58
-
59
-
60
-
61
-
62
-
63
-
64
-
65
-
66
-
67
-
68
-
69
-
70
-
71
-
72
-
73
-
74
-
75
-
76
-
77
-
78
-
79
-
80
-
81
-
82
-
83
-
84
-
85
-
86
-
87
-
88
-
89
-
90
-
91
-
92
-
93
-
94
-
95
-
96
-
97
-
98
-
99
-
100
-
101
-
102
-
103
-
104
-
105
-
106
-
107
-
108
-
109
-
110
-
111
-
112
-
113
-
114
-
115
-
116
-
117
-
 118
118 -
 119
119 -
 120
120 -
 121
121 -
 122
122 -
 123
123 -
 124
124 -
 125
125 -
 126
126 -
 127
127 -
 128
128 -
 129
129 -
 130
130 -
 131
131 -
 132
132 -
 133
133 -
 134
134 -
 135
135 -
 136
136 -
 137
137 -
 138
138 -
139
-
140
-
141
-
142
-
143
-
144
 |
 |

• Financial information Financial information •
252 253
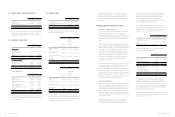
Management believed that the above unlisted equity
investments and mutual funds held by the Company, whose
fair value cannot be reliably measured due to the range of
reasonable fair value estimates was so significant; therefore,
they were measured at cost less impairment at the end of
reporting period.
The Company disposed of the investments in Primavera
Capital (Cayman) Fund L.L.P. and Shanghai F-road
Commercial Co., Ltd. in May 2014. Furthermore, the
Company made a partial disposal of shares of KKBOX Inc. in
August 2014. These transactions resulted in the recognition of
a gain in profit or loss, calculated as follows:
Proceeds of disposal $ 2,358,135
Less: Carrying amount of investment
on the date of disposal (2,200,140)
Gain recognized $ 157,995
In 2014, the Company determined that the recoverable
amount of financial assets measured at cost was less than its
carrying amount and thus recognized an impairment loss of
$373,257 thousand.
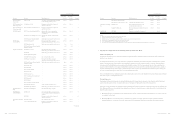
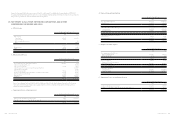
10. OTHER CURRENT FINANCIAL
ASSETS
December 31
2014 2013
Time deposits with original
maturities more than three months $ 334,954 $ 411,982
Trust assets for employee benefit - 2,359,041
$ 334,954 $ 2,771,023
To protect the rights and interests of its employees, the
Company deposited unpaid employee bonus in a new trust
account in September 2012. The Company had paid the
employee bonus and close the trust account in August 2014.
For details of pledged other current financial assets, please
refer to Note 31.
As of the reporting date, the Company had no receivables
that are past due but not impaired.
Age of impaired trade receivables
December 31
2014 2013
1-90 days
91-180 days
Over 181 days
$ 2,946,423
-
-
$ 3,714,226
1,468,049
803,422
$ 2,946,423 $ 5,985,697
The above was shown after deducting the allowance for
impairment loss and analyzed on the basis of the past due
date.
Movement in the allowance for impairment loss on trade
receivables were as follow:
Movement in the allowances for impairment loss
For the Year Ended
December 31
2014 2013
Balance, beginning of the year
Add: Impairment losses
recognized on receivables
Less: Amounts written off as
uncollectible
Disposal of subsidiary
Translation adjustment
$ 3,050,907
3,875
-
-
-
$ 2,086,085
1,010,405
(13,943)
(32,453)
813
Balance, end of the year $ 3,054,782 $ 3,050,907
Other Receivables
Receivable from disposal of investments is derived from sale
of shares of Saffron Media Group Ltd. in 2013. According to
the agreement, the principle and interest will be received
in full in September 2018 and could be repaid by the buyer
in whole or in part, at any time. For details of disposal of
subsidiaries, please refer to Note 27.
Others were primarily prepayments on behalf of vendors or
customers, grants from suppliers and withholding income
tax of employees’ bonuses.
11. TRADE RECEIVABLES AND OTHER
RECEIVABLES
December 31
2014 2013
Trade receivables
Trade receivables
Trade receivables - related parties
Less: Allowances for impairment
loss
$ 32,194,141
925
(3,054,782)
$ 26,420,770
1,309
(3,050,907)
$ 29,140,284 $ 23,371,172
Other receivables
Receivables from disposal of
investments
VAT refund receivables
Interest receivables
Others
$ 1,251,073
246,900
102,771
327,005
$ 1,182,393
355,442
10,878
1,771,333
$ 1,927,749 $ 3,320,046
Current - other receivables $ 584,936 $ 2,137,653
Non-current - other receivables 1,342,813 1,182,393
$ 1,927,749 $ 3,320,046
Trade Receivables
The credit period on sales of goods is 30-75 days. No
interest is charged on trade receivables before the due
date. Thereafter, interest is charged at 1-18% per annum
on the outstanding balance, which is considered to be non-
controversial, to some of customers. In determining the
recoverability of a trade receivable, the Company considered
any change in the credit quality of the trade receivable
since the date credit was initially granted to the end of
the reporting period. For customers with low credit risk,
the Company has recognized an allowance for doubtful
debts of 1-5% against receivables past due beyond 31-90
days and of 5-100% against receivables past due beyond 91
days. For customers with high credit risk, the Company has
recognized an allowance for impairment loss of 10-100%
against receivables past due more than 31 days.
Before accepting any new customer, the Company’s
Department of Financial and Accounting evaluates the
potential customer’s credit quality and defines credit limits
and scorings by customer. The factor of overdue attributed
to customers are reviewed once a week and the Company
evaluates the financial performance periodically for the
adjustment of credit limits.
The concentration of credit risk is limited due to the fact
that the customer base is diverse.
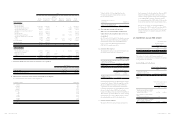
12. INVENTORIES
December 31
2014 2013
Finished goods
Work-in-process
Semi-finished goods
Raw materials
Inventory in transit
$ 2,925,203
686,398
3,692,029
9,491,854
417,576
$ 3,487,921
521,423
8,244,216
11,074,773
271,225
$ 17,213,060 $ 23,599,558
The losses on inventories decline amounting to NT$521,692
thousand and NT$417,166 thousand were recognized as cost
of revenues for the years ended December 31, 2014 and 2013,
respectively.
13. PREPAYMENTS
December 31
2014 2013
Royalty
Net input VAT
Prepayments to suppliers
Software and hardware
maintenance
Service
Prepaid equipment
Land use right
Molding expenses
Others
$ 12,068,674
1,848,355
1,577,566
205,415
203,186
168,983
139,502
29,151
303,121
$ 12,007,756
1,918,462
2,492,197
139,958
113,661
194,200
138,376
304,411
234,123
$ 16,543,953 $ 17,543,144
Current
Non-current
$ 6,626,106
9,917,847
$ 5,803,744
11,739,400
$ 16,543,953 $ 17,543,144
Prepayments for royalty were primarily for getting royalty
right and were classified as current or non-current in
accordance with their nature. For details of content of
contracts, please refer to Note 34.
Prepayments to suppliers were primarily for discount
purposes and were classified as current or non-current in
accordance with their nature.