HTC 2014 Annual Report Download - page 134
Download and view the complete annual report
Please find page 134 of the 2014 HTC annual report below. You can navigate through the pages in the report by either clicking on the pages listed below, or by using the keyword search tool below to find specific information within the annual report.-
 1
1 -
2
-
3
-
4
-
5
-
6
-
7
-
8
-
9
-
10
-
11
-
12
-
13
-
14
-
15
-
16
-
17
-
18
-
19
-
20
-
21
-
22
-
23
-
24
-
25
-
26
-
27
-
28
-
29
-
30
-
31
-
32
-
33
-
34
-
35
-
36
-
37
-
38
-
39
-
40
-
41
-
42
-
43
-
44
-
45
-
46
-
47
-
48
-
49
-
50
-
51
-
52
-
53
-
54
-
55
-
56
-
57
-
58
-
59
-
60
-
61
-
62
-
63
-
64
-
65
-
66
-
67
-
68
-
69
-
70
-
71
-
72
-
73
-
74
-
75
-
76
-
77
-
78
-
79
-
80
-
81
-
82
-
83
-
84
-
85
-
86
-
87
-
88
-
89
-
90
-
91
-
92
-
93
-
94
-
95
-
96
-
97
-
98
-
99
-
100
-
101
-
102
-
103
-
104
-
105
-
106
-
107
-
108
-
109
-
110
-
111
-
112
-
113
-
114
-
115
-
116
-
117
-
118
-
119
-
120
-
121
-
122
-
123
-
 124
124 -
 125
125 -
 126
126 -
 127
127 -
 128
128 -
 129
129 -
 130
130 -
 131
131 -
 132
132 -
 133
133 -
 134
134 -
 135
135 -
 136
136 -
 137
137 -
 138
138 -
 139
139 -
 140
140 -
 141
141 -
 142
142 -
 143
143 -
 144
144
 |
 |
• Financial information Financial information •
264 265
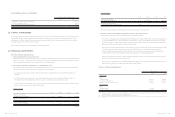
Some sales denominated in foreign currencies were hedged for cash flow risk. Accordingly, the Company transferred NT$102,057
thousand and NT$262,648 thousand of the gain or loss on the hedging instrument that was determined to be the effective portion of the
hedge to sales of goods for the years ended in 2014 and 2013, respectively.
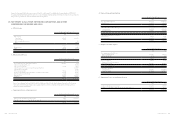
23. NET PROFIT (LOSS) FROM CONTINUING OPERATIONS AND OTHER
COMPREHENSIVE INCOME AND LOSS
a. Other income
For the Year Ended December 31
2014 2013
Interest income
Cash in bank
Other receivables
Held-to-maturity financial assets
Loan
$ 307,005
96,150
-
-
$ 342,422
-
794
211,139
403,155 554,355
Dividend income
Others
26,381
404,588
16,282
594,311
$ 834,124 $ 1,164,948
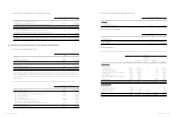
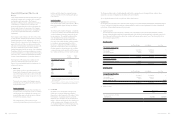
b. Other gains and losses
For the Year Ended December 31
2014 2013
Losses on disposal of property, plant and equipment
Gain on disposal of intangible assets
Gains on sale of investments
Gain on disposal of investments accounted for using equity method
Gain on disposal of subsidiaries
Net foreign exchange gains
Net gains arising on financial assets and liabilities classified as held for trading
Ineffective portion of cash flow hedge
Impairment losses
Other losses
$ (153,493)
-
157,995
-
-
855,412
240,120
1,939
(547,510)
(48,269)
$ (58)
108,265
29,735
2,637,673
175,435
109,960
162,297
151,305
(864,352)
(88,994)
$ 506,194 $ 2,421,266
Gain or loss on financial assets and liabilities held for trading was derived from forward exchange transactions. The Company
entered into forward exchange transactions to manage exposures related to exchange rate fluctuations of foreign currency
denominated assets and liabilities.
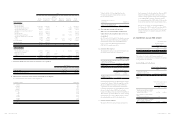
c. Impairment losses on financial assets
For the Year Ended December 31
2014 2013
Trade receivables (included in operating expense)
Financial assets measured at cost (included in other gains and losses)
$ 3,875
373,257
$ 1,010,405
-
$ 377,132 $ 1,010,405
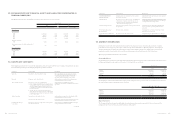
d. Depreciation and amortization
For the Year Ended December 31
2014 2013
Property, plant and equipment
Intangible assets
$ 2,952,892
1,868,817
$ 2,916,699
1,968,492
$ 4,821,709 $ 4,885,191
Classification of depreciation - by function
Cost of revenues
Operating expenses
$ 1,610,472
1,342,420
$ 1,538,825
1,377,874
$ 2,952,892 $ 2,916,699
Classification of amortization - by function
Cost of revenues
Operating expenses
$ 19,788
1,849,029
$ 6,841
1,961,651
$ 1,868,817 $ 1,968,492
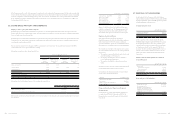
e. Employee benefits expense
For the Year Ended December 31
2014 2013
Post-employment benefits (Note 20)
Defined contribution plans
Defined benefit plans
$ 787,960
6,591
$ 786,658
1,122
794,551 787,780
Share-based payments
Equity-settled share-based payments
Other employee benefits
269,013
16,422,150
26,742
17,517,784
Total employee benefits expense $ 17,485,714 $ 18,332,306
Classification - by function
Cost of revenues
Operating expenses
$ 5,771,740
11,713,974
$ 6,539,452
11,792,854
$ 17,485,714 $ 18,332,306
f. Impairment losses on non-financial assets
For the Year Ended December 31
2014 2013
Inventories (included in cost of revenues)
Intangible assets (including goodwill) (included in other gains and losses)
$ 521,692
174,253
$ 417,166
864,352
$ 695,945 $ 1,281,518