HTC 2014 Annual Report Download - page 26
Download and view the complete annual report
Please find page 26 of the 2014 HTC annual report below. You can navigate through the pages in the report by either clicking on the pages listed below, or by using the keyword search tool below to find specific information within the annual report.-
 1
1 -
2
-
3
-
4
-
5
-
6
-
7
-
8
-
9
-
10
-
11
-
12
-
13
-
14
-
15
-
 16
16 -
 17
17 -
 18
18 -
 19
19 -
 20
20 -
 21
21 -
 22
22 -
 23
23 -
 24
24 -
 25
25 -
 26
26 -
 27
27 -
 28
28 -
 29
29 -
 30
30 -
 31
31 -
 32
32 -
 33
33 -
 34
34 -
 35
35 -
 36
36 -
37
-
38
-
39
-
40
-
41
-
42
-
43
-
44
-
45
-
46
-
47
-
48
-
49
-
50
-
51
-
52
-
53
-
54
-
55
-
56
-
57
-
58
-
59
-
60
-
61
-
62
-
63
-
64
-
65
-
66
-
67
-
68
-
69
-
70
-
71
-
72
-
73
-
74
-
75
-
76
-
77
-
78
-
79
-
80
-
81
-
82
-
83
-
84
-
85
-
86
-
87
-
88
-
89
-
90
-
91
-
92
-
93
-
94
-
95
-
96
-
97
-
98
-
99
-
100
-
101
-
102
-
103
-
104
-
105
-
106
-
107
-
108
-
109
-
110
-
111
-
112
-
113
-
114
-
115
-
116
-
117
-
118
-
119
-
120
-
121
-
122
-
123
-
124
-
125
-
126
-
127
-
128
-
129
-
130
-
131
-
132
-
133
-
134
-
135
-
136
-
137
-
138
-
139
-
140
-
141
-
142
-
143
-
144
 |
 |

• Business operations Business operations •
48 49
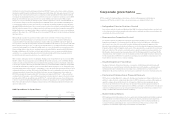
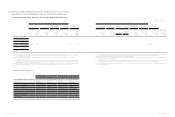
Major Suppliers / Customers Representing at Least
10% of Gross Purchase / Revenue for the Most
Recent Two-Year Period
(1) Major suppliers representing at least 10% of gross purchase
Unit: NT$ millions
2014
Supplier Code Amount % Relation to HTC
a 20,628 13 None
Others 144,056 87
Total 164,684 100
2013
Supplier Code Amount % Relation to HTC
a 22,566 18 None
Others 100,375 82
Total 122,941 100
2015Q1
Supplier Code Amount % Relation to HTC
a 6,016 21 None
Others 22,101 79
Total 28,117 100
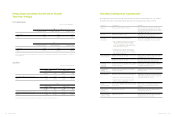
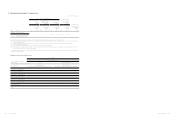
(2) Major customers representing at least 10% of gross revenue
Unit: NT$ millions
2014
Customer Code Amount % Relation to HTC
Major customers representing at least 10% of gross revenue N/A N/A
Others 187,911 100
Total 187,911 100
2013
Customer Code Amount % Relation to HTC
Major customers representing at least 10% of gross revenue N/A N/A
Others 203,403 100
Total 203,403 100
2015 Q1
Customer Code Amount % Relation to HTC
A 5,313 13 None
B 4,367 10 None
Others 31,844 77
Total 41,524 100