HTC 2014 Annual Report Download - page 103
Download and view the complete annual report
Please find page 103 of the 2014 HTC annual report below. You can navigate through the pages in the report by either clicking on the pages listed below, or by using the keyword search tool below to find specific information within the annual report.-
 1
1 -
2
-
3
-
4
-
5
-
6
-
7
-
8
-
9
-
10
-
11
-
12
-
13
-
14
-
15
-
16
-
17
-
18
-
19
-
20
-
21
-
22
-
23
-
24
-
25
-
26
-
27
-
28
-
29
-
30
-
31
-
32
-
33
-
34
-
35
-
36
-
37
-
38
-
39
-
40
-
41
-
42
-
43
-
44
-
45
-
46
-
47
-
48
-
49
-
50
-
51
-
52
-
53
-
54
-
55
-
56
-
57
-
58
-
59
-
60
-
61
-
62
-
63
-
64
-
65
-
66
-
67
-
68
-
69
-
70
-
71
-
72
-
73
-
74
-
75
-
76
-
77
-
78
-
79
-
80
-
81
-
82
-
83
-
84
-
85
-
86
-
87
-
88
-
89
-
90
-
91
-
92
-
 93
93 -
 94
94 -
 95
95 -
 96
96 -
 97
97 -
 98
98 -
 99
99 -
 100
100 -
 101
101 -
 102
102 -
 103
103 -
 104
104 -
 105
105 -
 106
106 -
 107
107 -
 108
108 -
 109
109 -
 110
110 -
 111
111 -
 112
112 -
 113
113 -
114
-
115
-
116
-
117
-
118
-
119
-
120
-
121
-
122
-
123
-
124
-
125
-
126
-
127
-
128
-
129
-
130
-
131
-
132
-
133
-
134
-
135
-
136
-
137
-
138
-
139
-
140
-
141
-
142
-
143
-
144
 |
 |
• Financial information Financial information •
202 203
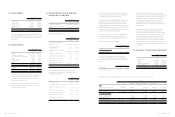
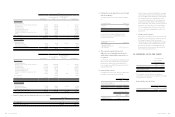
2013
Land Buildings
Property in
Construction
Machinery and
Equipment Other Equipment Total
Cost
Balance, beginning of the year
Additions
Disposal
Reclassification
Transfer to expense
$7,462,489
-
-
-
-
$9,520,993
270,787
(5,995)
18,726
-
$-
1,581
-
-
(1,581)
$8,732,565
1,069,092
(56,518)
(1,664)
-
$969,180
309,839
(64,456)
(17,062)
-
$26,685,227
1,651,299
(126,969)
-
(1,581)
Balance, end of the year 7,462,489 9,804,511 - 9,743,475 1,197,501 28,207,976
Accumulated depreciation
Balance, beginning of the year
Depreciation expenses
Disposal
Reclassification
-
-
-
-
1,190,386
356,332
(5,995)
18,726
-
-
-
-
5,158,999
1,113,388
(56,518)
(1,664)
609,006
133,226
(64,456)
(17,062)
6,958,391
1,602,946
(126,969)
-
Balance, end of the year - 1,559,449 - 6,214,205 660,714 8,434,368
Net book value, end of the year $7,462,489 $8,245,062 $- $3,529,270 $536,787 $19,773,608
The above items of property, plant and equipment were depreciated on a straight-line basis at the following rates per annum:
Building 5-50 years
Machinery and equipment 3-6 years
Other equipment 3-5 years
The major component parts of the buildings held by the Company included plants, electro-powering machinery and engineering
systems, etc., which were depreciated over their estimated useful lives of 40 to 50 years, 20 years and 5 to 10 years, respectively.
There were no interests capitalized for the years ended December 31, 2014 and 2013.
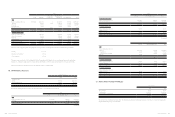
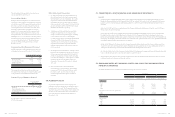
16. INTANGIBLE ASSETS
December 31
2014 2013
Carrying amounts
Patents
Other intangible assets
$579,118
643,603
$1,027,295
623,596
$1,222,721 $1,650,891
Movements of intangible assets for the years ended December 31, 2014 and 2013 were as follows:
2014
Patents Other Intangible Assets Total
Cost
Balance, beginning of the year
Additions
$2,516,290
-
$822,150
221,717
$3,338,440
221,717
Balance, end of the year 2,516,290 1,043,867 3,560,157
2014
Patents Other Intangible Assets Total
Accumulated amortization
Balance, beginning of the year
Amortization expenses
$1,377,910
448,177
$198,554
201,710
$1,576,464
649,887
Balance, end of the year 1,826,087 400,264 2,226,351
Accumulated impairment
Balance, beginning of the year
Impairment losses
111,085
-
-
-
111,085
-
Balance, end of the year 111,085 - 111,085
Net book value, end of the year $579,118 $643,603 $11,222,721
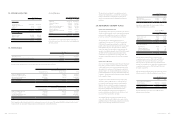
(Concluded)
2013
Patents Other Intangible Assets Total
Cost
Balance, beginning of the year
Additions
Acquisition
Transfer from prepayment
Disposal
$2,500,854
22,214
-
(6,778)
$141,128
171,312
509,710
-
$2,641,982
193,526
509,710
(6,778)
Balance, end of the year 2,516,290 822,150 3,338,440
Accumulated amortization
Balance, beginning of the year
Amortization expenses
875,514
502,396
49,318
149,236
924,832
651,632
Balance, end of the year 1,377,910 198,554 1,576,464
Accumulated impairment
Balance, beginning of the year
Impairment losses
-
111,085
-
-
-
111,085
Balance, end of the year 111,085 - 111,085
Net book value, end of the year $1,027,295 $623,596 $1,650,891
17. NOTE AND TRADE PAYABLES
December 31
2014 2013
Note payables
Trade payables
Trade payables - related parties
$1,073
40,814,737
6,508,521
$1,355
42,787,368
5,622,019
$47,324,331 $48,410,742
The average term of payment is four months. The Company has financial risk management policies in place to ensure that all payables
are paid within the pre-agreed credit terms.
(Continued)