HTC 2014 Annual Report Download - page 136
Download and view the complete annual report
Please find page 136 of the 2014 HTC annual report below. You can navigate through the pages in the report by either clicking on the pages listed below, or by using the keyword search tool below to find specific information within the annual report.-
 1
1 -
2
-
3
-
4
-
5
-
6
-
7
-
8
-
9
-
10
-
11
-
12
-
13
-
14
-
15
-
16
-
17
-
18
-
19
-
20
-
21
-
22
-
23
-
24
-
25
-
26
-
27
-
28
-
29
-
30
-
31
-
32
-
33
-
34
-
35
-
36
-
37
-
38
-
39
-
40
-
41
-
42
-
43
-
44
-
45
-
46
-
47
-
48
-
49
-
50
-
51
-
52
-
53
-
54
-
55
-
56
-
57
-
58
-
59
-
60
-
61
-
62
-
63
-
64
-
65
-
66
-
67
-
68
-
69
-
70
-
71
-
72
-
73
-
74
-
75
-
76
-
77
-
78
-
79
-
80
-
81
-
82
-
83
-
84
-
85
-
86
-
87
-
88
-
89
-
90
-
91
-
92
-
93
-
94
-
95
-
96
-
97
-
98
-
99
-
100
-
101
-
102
-
103
-
104
-
105
-
106
-
107
-
108
-
109
-
110
-
111
-
112
-
113
-
114
-
115
-
116
-
117
-
118
-
119
-
120
-
121
-
122
-
123
-
124
-
125
-
 126
126 -
 127
127 -
 128
128 -
 129
129 -
 130
130 -
 131
131 -
 132
132 -
 133
133 -
 134
134 -
 135
135 -
 136
136 -
 137
137 -
 138
138 -
 139
139 -
 140
140 -
 141
141 -
 142
142 -
 143
143 -
 144
144
 |
 |

• Financial information Financial information •
268 269
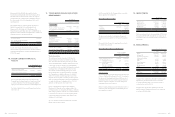
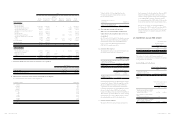
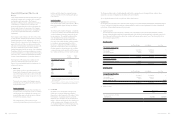
2013
Opening
Balance
Recognized in
Profit or Loss
Recognized
in Other
Comprehensive
Income
Disposal of
Subsidiaries
Translation
Adjustment
Closing
Balance
Deferred tax assets
Temporary differences
Unrealized royalties
Unrealized marketing expenses
Unrealized warranty expense
Allowance for loss on decline in value of
inventory
Unrealized profit
Unrealized salary and welfare
Unrealized contingent losses on purchase
orders
Others
Loss carryforwards
$ 2,985,884
2,336,469
859,853
756,462
365,524
357,322
70,779
294,018
484
$ (556,451)
(57,711)
(162,739)
(220,526)
(63,257)
8,236
29,166
158,624
1,449,272
$ -
-
-
-
-
-
-
(915)
-
$ -
-
-
-
-
(1,416)
-
(3,295)
(508)
$ -
60,145
15,320
16,100
-
10,783
-
(42,758)
370
$ 2,429,433
2,338,903
712,434
552,036
302,267
374,925
99,945
405,674
1,449,618
Investment credits 663,047 (663,047) - - - -
$ 8,689,842 $ (78,433) $ (915) $ (5,219) $ 59,960 $ 8,665,235
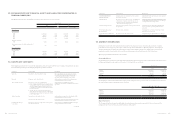
Deferred tax liabilities
Temporary differences
Unrealized gain on investments
Financial assets at FVTPL
Defined benefit plans
Others
$ 470,743
2,961
35,034
139,198
$ (407,873)
16,515
(17,227)
(60,078)
$ -
-
(2,709)
-
$ -
-
-
(2,622)
$ 16,580
-
-
(39,400)
$ 79,450
19,476
15,098
37,098
$ 647,936 $ (468,663) $ (2,709) $ (2,622) $ (22,820) $ 151,122
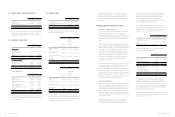
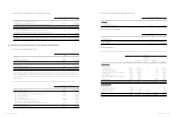
e. Items for which no deferred tax assets have been recognized
December 31
2014 2013
Loss carryforward $ 1,041,574 $ 553,280
Deductible temporary differences $ 3,470,768 $ 4,587,454
f. Information about unused loss carry-forward and tax-exemption
Loss carryforwards as of December 31, 2014 comprised of:
Remaining Carrying Expiry Year
$ 107,539
2,447,622
605,689
7,662,140
10,525,277
970
17,270
23,485
135,366
60,908
30,905
2015
2018
2019
2023
2024
2027
2028
2029
2030
2031
2032
$ 21,617,171
Under the Statute for Upgrading Industries, the
Company was granted exemption from corporate
income tax for as follows:
Item Exempt from Corporate
Income Tax Expiry Year
Sales of wireless and smartphone
which has 3.5G and GPS function 2015.01.01-2018.09.30
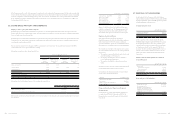
g. The aggregate amount of temporary
difference associated with investments for
which deferred tax liabilities have not been
recognized
As of December 31, 2014 and 2013, the taxable temporary
differences associated with investment in subsidiaries
and branch for which no deferred tax liabilities have
been recognized were NT$897,465 thousand and
NT$559,255 thousand, respectively.
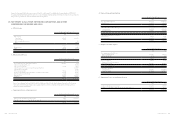
h. Integrated income tax
The imputation credit account (“ICA”) information as of
December 31, 2014 and 2013, were as follows:
December 31
2014 2013
Unappropriated earnings
generated on and after January
1, 1998 $ 41,381,753 $ 47,282,820
Balance of ICA $ 8,164,935 $ 6,573,169
For the Year Ended December 31
2014
(Expected)
2013
(Actual)
Creditable ratio for
distribution of earning 19.73% -
Under the Income Tax Law, for distribution of earnings
generated after January 1, 1998, the imputation credits
allocated to ROC resident shareholders of HTC was
calculated based on the creditable ratio as of the date
of dividend distribution. The actual imputation credits
allocated to shareholders of HTC was based on the
balance of the ICA as of the date of dividend distribution.
Therefore, the expected creditable ratio for the earnings
may differ from the actual creditable ratio to be used in
allocating imputation credits to the shareholders.
i. Income tax assessments
Except 2011, HTC’s income tax returns through 2012
had been assessed by the tax authorities. However, HTC
disagreed with the tax authorities’ assessment on its
returns for unappropriated earnings of 2009 and applied
for the administrative remedial. Nevertheless, under
the conservatism guideline, HTC adjusted its income tax
for the tax shortfall stated in the tax assessment notices.
The income tax returns of Communication Global
Certification Inc., HTC Investment Corporation, HTC I
Investment Corporation and Yoda Co., Ltd. for the years
through 2012 have been examined and approved by the
tax authorities.
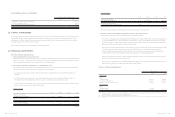
25. EARNINGS (LOSS) PER SHARE
Unit: NT$ Per Share
For the Year Ended
December 31
2014 2013
Basic earnings (loss) per share $ 1.80 $ (1.60)
Diluted earnings (loss) per share $ 1.80 $ (1.60)
The earnings (loss) and weighted average number of
ordinary shares outstanding for the computation of earnings
(loss) per share were as follows:
Net Profit (Loss) for the Years
For the Year Ended December 31
2014 2013
Profit (loss) for the year
attributable to owners of the
parent $ 1,483,046 $ (1,323,785)
Shares
Unit: In Thousands of Shares
For the Year Ended
December 31
2014 2013
Weighted average number of ordinary
shares used in computation of basic
earnings (loss) per share 824,194 829,082
Effect of dilutive potential ordinary
shares:
Bonus issue to employees 622 -
Weighted average number of ordinary
shares used in the computation of
diluted earnings (loss) per share 824,816 829,082