HTC 2014 Annual Report Download - page 101
Download and view the complete annual report
Please find page 101 of the 2014 HTC annual report below. You can navigate through the pages in the report by either clicking on the pages listed below, or by using the keyword search tool below to find specific information within the annual report.-
 1
1 -
2
-
3
-
4
-
5
-
6
-
7
-
8
-
9
-
10
-
11
-
12
-
13
-
14
-
15
-
16
-
17
-
18
-
19
-
20
-
21
-
22
-
23
-
24
-
25
-
26
-
27
-
28
-
29
-
30
-
31
-
32
-
33
-
34
-
35
-
36
-
37
-
38
-
39
-
40
-
41
-
42
-
43
-
44
-
45
-
46
-
47
-
48
-
49
-
50
-
51
-
52
-
53
-
54
-
55
-
56
-
57
-
58
-
59
-
60
-
61
-
62
-
63
-
64
-
65
-
66
-
67
-
68
-
69
-
70
-
71
-
72
-
73
-
74
-
75
-
76
-
77
-
78
-
79
-
80
-
81
-
82
-
83
-
84
-
85
-
86
-
87
-
88
-
89
-
90
-
 91
91 -
 92
92 -
 93
93 -
 94
94 -
 95
95 -
 96
96 -
 97
97 -
 98
98 -
 99
99 -
 100
100 -
 101
101 -
 102
102 -
 103
103 -
 104
104 -
 105
105 -
 106
106 -
 107
107 -
 108
108 -
 109
109 -
 110
110 -
 111
111 -
112
-
113
-
114
-
115
-
116
-
117
-
118
-
119
-
120
-
121
-
122
-
123
-
124
-
125
-
126
-
127
-
128
-
129
-
130
-
131
-
132
-
133
-
134
-
135
-
136
-
137
-
138
-
139
-
140
-
141
-
142
-
143
-
144
 |
 |

• Financial information Financial information •
198 199
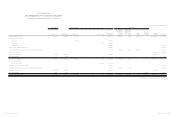
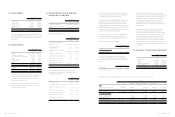
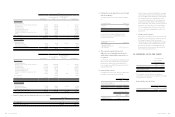
Forward Exchange Contracts
Buy/Sell Currency Maturity Date Notional Amount
(In Thousands)
December 31, 2014
Foreign exchange contracts
Foreign exchange contracts
Foreign exchange contracts
Foreign exchange contracts
Foreign exchange contracts
Foreign exchange contracts
Foreign exchange contracts
Sell
Sell
Sell
Sell
Buy
Buy
Buy
CAD/USD
EUR/USD
JPY/USD
GBP/USD
RMB/USD
USD/NTD
SGD/USD
2015.01.07-2015.03.17
2015.01.07
2015.01.07-2015.02.25
2015.01.07-2015.03.17
2015.01.07
2015.01.12-2015.03.04
2015.02.25-2015.03.04
CAD31,500
EUR6,000
JPY5,288,510
GBP30,100
RMB44,000
USD267,200
SGD88,985
December 31, 2013
Foreign exchange contracts
Foreign exchange contracts
Foreign exchange contracts
Foreign exchange contracts
Foreign exchange contracts
Foreign exchange contracts
Foreign exchange contracts
Foreign exchange contracts
Foreign exchange contracts
Foreign exchange contracts
Sell
Sell
Sell
Sell
Sell
Buy
Buy
Buy
Buy
Buy
EUR/USD
JPY/USD
GBP/USD
USD/NTD
CAD/USD
USD/RMB
CAD/USD
RMB/USD
EUR/USD
GBP/USD
2014.01.01-2014.01.29
2014.03.31
2014.01.15-2014.01.22
2014.01.06-2014.02.05
2014.01.13-2014.01.29
2014.01.08-2014.01.22
2014.01.13
2014.01.08
2014.01.15-2014.01.22
2014.01.15-2014.01.22
EUR61,000
JPY3,755,090
GBP12,000
USD391,700
CAD5,500
USD100,600
CAD4,000
RMB11,000
EUR18,000
GBP2,000
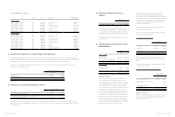
8. DERIVATIVE FINANCIAL INSTRUMENTS FOR HEDGING
The Company’s foreign-currency cash flows derived from the highly probable forecast transaction may lead to risks on foreign-currency
financial assets and liabilities and estimated future cash flows due to the exchange rate fluctuations. The Company assesses the risks may
be significant; thus, the Company entered into derivative contracts to hedge against foreign-currency exchange risks.
Gains and losses of hedging instruments transferred from equity to profit or loss were included in the following line items in the
statements of comprehensive income:
For the Year Ended December 31
2014 2013
Revenues
Other gains and losses
$102,057
1,939
$262,648
151,305
$103,996 $413,953
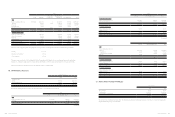
9. FINANCIAL ASSETS MEASURED AT COST
December 31
2014 2013
Domestic unlisted equity investment $515,861 $515,861
Classified according to financial asset measurement categories
Available-for-sale financial assets $515,861 $515,861
Management believed that the above unlisted equity investments held by the Company, whose fair value cannot be reliably measured
due to the range of reasonable fair value estimates was so significant; therefore, they were measured at cost less impairment at the end of
reporting period.
10. OTHER CURRENT FINANCIAL
ASSETS
December 31
2014 2013
Trust assets for employee benefit $- $2,359,041
To protect the rights and interests of its employees, the
Company deposited unpaid employee bonus in a new trust
account in September 2012. The Company had paid the
employee bonus and close the trust account in August 2014.
For details of pledged other current financial assets, please
refer to Note 30.
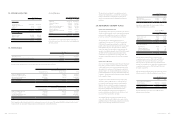
11. TRADE RECEIVABLES AND OTHER
RECEIVABLES
December 31
2014 2013
Trade receivables
Trade receivables
Trade receivables - related parties
Less: Allowances for impairment loss
$15,455,951
16,250,234
(3,050,907)
$17,017,529
13,203,577
(3,050,907)
$28,655,278 $27,170,199
Other receivables
VAT refund receivables
Interest receivables
Others
$58,468
8,592
257,367
$102,407
7,344
1,746,645
$324,427 $1,856,396
Trade Receivables
The credit period on sales of goods is 30-75 days. No
interest is charged on trade receivables before the due
date. Thereafter, interest is charged at 1%-18% per annum
on the outstanding balance, which is considered to be non-
controversial, to some of customers. In determining the
recoverability of a trade receivable, the Company considered
any change in the credit quality of the trade receivable
since the date credit was initially granted to the end of the
reporting period. For customers with low credit risk, the
Company has recognized an allowance for doubtful debts
of 1%-5% against receivables past due beyond 31-90 days
and of 5%-100% against receivables past due beyond 91
days. For customers with high credit risk, the Company has
recognized an allowance for impairment loss of 10%-100%
against receivables past due more than 31 days.
Before accepting any new customer, the Company’s
Department of Financial and Accounting evaluates the
potential customer’s credit quality and defines credit limits
and scorings by customer. The factor of overdue attributed
to customers are reviewed once a week and the Company
evaluates the financial performance periodically for the
adjustment of credit limits.
The concentration of credit risk is limited due to the fact
that the customer base is diverse.
As of the reporting date, the Company had no receivables
that are past due but not impaired.
Age of impaired trade receivables
December 31
2014 2013
1-90 days $8,233,369 $10,471,140
91-180 days 3,949,897 406,751
Over 181 days - -
$12,183,266 $10,877,891
The above was shown after deducting the allowance for
impairments loss and analyzed on the basis of the past due
date.
Movement in the allowance for impairment loss on trade
receivables were as follow:
Movement in the allowances for impairment loss
For the Year Ended
December 31
2014 2013
Balance, beginning of the year $3,050,907 $2,073,018
Add: Impairment losses recognized
on receivables
-
991,821
Less: Amounts written off as
uncollectible
- (13,932)
Balance, end of the year $3,050,907 $3,050,907
Other Receivables
Others were primarily prepayments on behalf of vendors or
customers, grants from suppliers and withholding income
tax of employees’ bonuses.