HSBC 2015 Annual Report Download - page 60
Download and view the complete annual report
Please find page 60 of the 2015 HSBC annual report below. You can navigate through the pages in the report by either clicking on the pages listed below, or by using the keyword search tool below to find specific information within the annual report.-
 1
1 -
2
-
3
-
4
-
5
-
6
-
7
-
8
-
9
-
10
-
11
-
12
-
13
-
14
-
15
-
16
-
17
-
18
-
19
-
20
-
21
-
22
-
23
-
24
-
25
-
26
-
27
-
28
-
29
-
30
-
31
-
32
-
33
-
34
-
35
-
36
-
37
-
38
-
39
-
40
-
41
-
42
-
43
-
44
-
45
-
46
-
47
-
48
-
49
-
 50
50 -
 51
51 -
 52
52 -
 53
53 -
 54
54 -
 55
55 -
 56
56 -
 57
57 -
 58
58 -
 59
59 -
 60
60 -
 61
61 -
 62
62 -
 63
63 -
 64
64 -
 65
65 -
 66
66 -
 67
67 -
 68
68 -
 69
69 -
 70
70 -
71
-
72
-
73
-
74
-
75
-
76
-
77
-
78
-
79
-
80
-
81
-
82
-
83
-
84
-
85
-
86
-
87
-
88
-
89
-
90
-
91
-
92
-
93
-
94
-
95
-
96
-
97
-
98
-
99
-
100
-
101
-
102
-
103
-
104
-
105
-
106
-
107
-
108
-
109
-
110
-
111
-
112
-
113
-
114
-
115
-
116
-
117
-
118
-
119
-
120
-
121
-
122
-
123
-
124
-
125
-
126
-
127
-
128
-
129
-
130
-
131
-
132
-
133
-
134
-
135
-
136
-
137
-
138
-
139
-
140
-
141
-
142
-
143
-
144
-
145
-
146
-
147
-
148
-
149
-
150
-
151
-
152
-
153
-
154
-
155
-
156
-
157
-
158
-
159
-
160
-
161
-
162
-
163
-
164
-
165
-
166
-
167
-
168
-
169
-
170
-
171
-
172
-
173
-
174
-
175
-
176
-
177
-
178
-
179
-
180
-
181
-
182
-
183
-
184
-
185
-
186
-
187
-
188
-
189
-
190
-
191
-
192
-
193
-
194
-
195
-
196
-
197
-
198
-
199
-
200
-
201
-
202
-
203
-
204
-
205
-
206
-
207
-
208
-
209
-
210
-
211
-
212
-
213
-
214
-
215
-
216
-
217
-
218
-
219
-
220
-
221
-
222
-
223
-
224
-
225
-
226
-
227
-
228
-
229
-
230
-
231
-
232
-
233
-
234
-
235
-
236
-
237
-
238
-
239
-
240
-
241
-
242
-
243
-
244
-
245
-
246
-
247
-
248
-
249
-
250
-
251
-
252
-
253
-
254
-
255
-
256
-
257
-
258
-
259
-
260
-
261
-
262
-
263
-
264
-
265
-
266
-
267
-
268
-
269
-
270
-
271
-
272
-
273
-
274
-
275
-
276
-
277
-
278
-
279
-
280
-
281
-
282
-
283
-
284
-
285
-
286
-
287
-
288
-
289
-
290
-
291
-
292
-
293
-
294
-
295
-
296
-
297
-
298
-
299
-
300
-
301
-
302
-
303
-
304
-
305
-
306
-
307
-
308
-
309
-
310
-
311
-
312
-
313
-
314
-
315
-
316
-
317
-
318
-
319
-
320
-
321
-
322
-
323
-
324
-
325
-
326
-
327
-
328
-
329
-
330
-
331
-
332
-
333
-
334
-
335
-
336
-
337
-
338
-
339
-
340
-
341
-
342
-
343
-
344
-
345
-
346
-
347
-
348
-
349
-
350
-
351
-
352
-
353
-
354
-
355
-
356
-
357
-
358
-
359
-
360
-
361
-
362
-
363
-
364
-
365
-
366
-
367
-
368
-
369
-
370
-
371
-
372
-
373
-
374
-
375
-
376
-
377
-
378
-
379
-
380
-
381
-
382
-
383
-
384
-
385
-
386
-
387
-
388
-
389
-
390
-
391
-
392
-
393
-
394
-
395
-
396
-
397
-
398
-
399
-
400
-
401
-
402
-
403
-
404
-
405
-
406
-
407
-
408
-
409
-
410
-
411
-
412
-
413
-
414
-
415
-
416
-
417
-
418
-
419
-
420
-
421
-
422
-
423
-
424
-
425
-
426
-
427
-
428
-
429
-
430
-
431
-
432
-
433
-
434
-
435
-
436
-
437
-
438
-
439
-
440
-
441
-
442
-
443
-
444
-
445
-
446
-
447
-
448
-
449
-
450
-
451
-
452
-
453
-
454
-
455
-
456
-
457
-
458
-
459
-
460
-
461
-
462
-
463
-
464
-
465
-
466
-
467
-
468
-
469
-
470
-
471
-
472
-
473
-
474
-
475
-
476
-
477
-
478
-
479
-
480
-
481
-
482
-
483
-
484
-
485
-
486
-
487
-
488
-
489
-
490
-
491
-
492
-
493
-
494
-
495
-
496
-
497
-
498
-
499
-
500
-
501
-
502
 |
 |

Report of the Directors: Financial summary (continued)
Group performance by income and expense item
HSBC HOLDINGS PLC
58
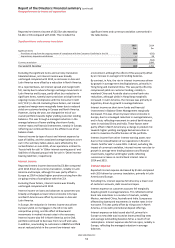
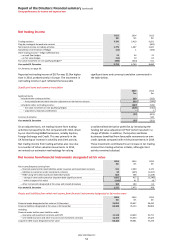
In the fourth quarter of 2015, our LICs increased compared
with the third quarter following a rise in individually
assessed LICs in a small number of countries. This was
reflective of specific circumstances associated with those
countries with no common underlying theme. In addition,
we increased our collectively assessed LICs on exposures
related to the oil and gas industry by $0.2bn, notably in
North America, Middle East and North Africa, and Asia. For
more information on our exposure to the oil and gas
sector, see page 117.
The following paragraphs set out in more detail the factors
that have contributed to movements in our collectively and
individually assessed LICs compared with 2014.
On an adjusted basis, collectively assessed LICs rose by
$221m, mainly in Middle East and North Africa, North
America and Asia, partly offset in Europe. It arose from
the following:
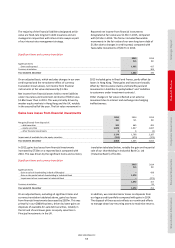
• in Middle East and North Africa (up by $167m), this was
mainly in the UAE in RBWM, where we increased
the impairment allowances on our mortgage book
following a review of the quality and value of collateral.
In addition, LICs grew in our CMB business, notably
relating to the oil and foodstuffs industries;
• in North America (up by $132m) and Asia (up by
$108m), this reflected an increase in allowances against
our oil and gas exposures. In our US CML portfolio, LICs
were higher than in 2014 reflecting lower favourable
market value adjustments of underlying properties as
improvements in the housing market conditions were
less pronounced in 2015. This was partly offset by a fall
in LICs from lower levels of newly impaired loans and
reduced lending balances from continued run-off and
sales. Additionally, collectively assessed LICs rose in
Indonesia following credit deterioration; and
• in Europe, collectively assessed LICs were $192m lower,
most notably in our GB&M business in the UK, as 2014
included additional impairment charges from revisions
to certain estimates used in our corporate collective
loan impairment calculation.
Individually assessed LICs were broadly unchanged from
2014 on an adjusted basis. This reflected decreases in Latin
America, Europe and Asia which were offset by increases in
Middle East and North Africa and in North America. This
included the following:
• in Latin America (down by $95m), Europe (down by
$44m) and Asia (down by $44m), we saw reductions in
individually assessed LICs in our GB&M business as 2014
included significant impairment charges related to
corporate clients in our respective regions. In Asia, the
reduction was partly offset by an increase in LICs against
a small number of CMB customers in Indonesia; and
• in Middle East and North Africa (up by $134m) and
North America (up by $47m), individually assessed LICs
increased in our CMB business. In the former, this
primarily related to higher LICs on food wholesalers,
while in North America LICs rose in the oil and gas
sector.
In 2015, there were lower net releases of credit risk
provisions than in 2014, down by $0.3bn, mainly on
available-for-sale asset-backed securities (‘ABS’s) in our
UK GB&M business.
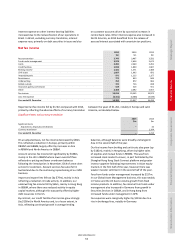
Operating expenses
In addition to detailing operating expense items by category,
as set out in the table below, we also categorise adjusted
expenses as follows:
• ‘run-the-bank’ costs comprise business-as-usual running costs
that keep operations functioning at the required quality and
standard year-on-year, maintain IT infrastructure and support
revenue growth. Run-the-bank costs are split between front
office and back office, reflecting the way the Group is
organised into four global businesses (‘front office’) supported
by global functions (‘back office’);
• ‘change-the-bank’ costs comprise expenses relating to the
implementation of mandatory regulatory changes and other
investment costs incurred relating to projects to change
business-as-usual activity to enhance future operating
capabilities;
• ‘costs-to-achieve’ comprise those specific costs relating to the
achievement of the strategic actions set out in the Investor
Update in June 2015. They comprise costs incurred between
1 July 2015 and 31 December 2017 and do not include
ongoing initiatives such as Global Standards. Any costs arising
within this category have been incurred as part of a significant
transformation programme. Costs-to-achieve are included
within significant items and incorporate restructuring costs
which were identified as a separate significant item prior to
1 July 2015; and
• the UK bank levy is reported as a separate category.
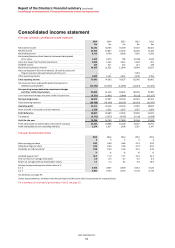
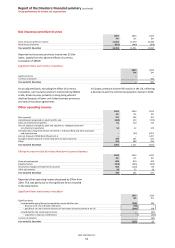
Operating expenses
2015 2014 2013
$m $m $m
By expense category
Employee compensation and benefits 19,900 20,366 19,196
Premises and equipment (excluding depreciation and impairment) 3,830 4,204 4,183
General and administrative expenses 13,832 14,361 12,882
Administrative expenses 37,562 38,931 36,261
Depreciation and impairment of property, plant and equipment 1,269 1,382 1,364
Amortisation and impairment of intangible assets 937 936 931
Year ended 31 December 39,768 41,249 38,556