HSBC 2015 Annual Report Download - page 390
Download and view the complete annual report
Please find page 390 of the 2015 HSBC annual report below. You can navigate through the pages in the report by either clicking on the pages listed below, or by using the keyword search tool below to find specific information within the annual report.-
 1
1 -
2
-
3
-
4
-
5
-
6
-
7
-
8
-
9
-
10
-
11
-
12
-
13
-
14
-
15
-
16
-
17
-
18
-
19
-
20
-
21
-
22
-
23
-
24
-
25
-
26
-
27
-
28
-
29
-
30
-
31
-
32
-
33
-
34
-
35
-
36
-
37
-
38
-
39
-
40
-
41
-
42
-
43
-
44
-
45
-
46
-
47
-
48
-
49
-
50
-
51
-
52
-
53
-
54
-
55
-
56
-
57
-
58
-
59
-
60
-
61
-
62
-
63
-
64
-
65
-
66
-
67
-
68
-
69
-
70
-
71
-
72
-
73
-
74
-
75
-
76
-
77
-
78
-
79
-
80
-
81
-
82
-
83
-
84
-
85
-
86
-
87
-
88
-
89
-
90
-
91
-
92
-
93
-
94
-
95
-
96
-
97
-
98
-
99
-
100
-
101
-
102
-
103
-
104
-
105
-
106
-
107
-
108
-
109
-
110
-
111
-
112
-
113
-
114
-
115
-
116
-
117
-
118
-
119
-
120
-
121
-
122
-
123
-
124
-
125
-
126
-
127
-
128
-
129
-
130
-
131
-
132
-
133
-
134
-
135
-
136
-
137
-
138
-
139
-
140
-
141
-
142
-
143
-
144
-
145
-
146
-
147
-
148
-
149
-
150
-
151
-
152
-
153
-
154
-
155
-
156
-
157
-
158
-
159
-
160
-
161
-
162
-
163
-
164
-
165
-
166
-
167
-
168
-
169
-
170
-
171
-
172
-
173
-
174
-
175
-
176
-
177
-
178
-
179
-
180
-
181
-
182
-
183
-
184
-
185
-
186
-
187
-
188
-
189
-
190
-
191
-
192
-
193
-
194
-
195
-
196
-
197
-
198
-
199
-
200
-
201
-
202
-
203
-
204
-
205
-
206
-
207
-
208
-
209
-
210
-
211
-
212
-
213
-
214
-
215
-
216
-
217
-
218
-
219
-
220
-
221
-
222
-
223
-
224
-
225
-
226
-
227
-
228
-
229
-
230
-
231
-
232
-
233
-
234
-
235
-
236
-
237
-
238
-
239
-
240
-
241
-
242
-
243
-
244
-
245
-
246
-
247
-
248
-
249
-
250
-
251
-
252
-
253
-
254
-
255
-
256
-
257
-
258
-
259
-
260
-
261
-
262
-
263
-
264
-
265
-
266
-
267
-
268
-
269
-
270
-
271
-
272
-
273
-
274
-
275
-
276
-
277
-
278
-
279
-
280
-
281
-
282
-
283
-
284
-
285
-
286
-
287
-
288
-
289
-
290
-
291
-
292
-
293
-
294
-
295
-
296
-
297
-
298
-
299
-
300
-
301
-
302
-
303
-
304
-
305
-
306
-
307
-
308
-
309
-
310
-
311
-
312
-
313
-
314
-
315
-
316
-
317
-
318
-
319
-
320
-
321
-
322
-
323
-
324
-
325
-
326
-
327
-
328
-
329
-
330
-
331
-
332
-
333
-
334
-
335
-
336
-
337
-
338
-
339
-
340
-
341
-
342
-
343
-
344
-
345
-
346
-
347
-
348
-
349
-
350
-
351
-
352
-
353
-
354
-
355
-
356
-
357
-
358
-
359
-
360
-
361
-
362
-
363
-
364
-
365
-
366
-
367
-
368
-
369
-
370
-
371
-
372
-
373
-
374
-
375
-
376
-
377
-
378
-
379
-
 380
380 -
 381
381 -
 382
382 -
 383
383 -
 384
384 -
 385
385 -
 386
386 -
 387
387 -
 388
388 -
 389
389 -
 390
390 -
 391
391 -
 392
392 -
 393
393 -
 394
394 -
 395
395 -
 396
396 -
 397
397 -
 398
398 -
 399
399 -
 400
400 -
401
-
402
-
403
-
404
-
405
-
406
-
407
-
408
-
409
-
410
-
411
-
412
-
413
-
414
-
415
-
416
-
417
-
418
-
419
-
420
-
421
-
422
-
423
-
424
-
425
-
426
-
427
-
428
-
429
-
430
-
431
-
432
-
433
-
434
-
435
-
436
-
437
-
438
-
439
-
440
-
441
-
442
-
443
-
444
-
445
-
446
-
447
-
448
-
449
-
450
-
451
-
452
-
453
-
454
-
455
-
456
-
457
-
458
-
459
-
460
-
461
-
462
-
463
-
464
-
465
-
466
-
467
-
468
-
469
-
470
-
471
-
472
-
473
-
474
-
475
-
476
-
477
-
478
-
479
-
480
-
481
-
482
-
483
-
484
-
485
-
486
-
487
-
488
-
489
-
490
-
491
-
492
-
493
-
494
-
495
-
496
-
497
-
498
-
499
-
500
-
501
-
502
 |
 |

HSBC HOLDINGS PLC
388
Notes on the Financial Statements (continued)
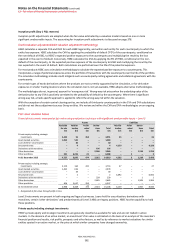
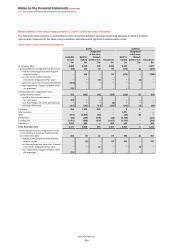
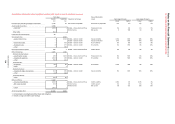
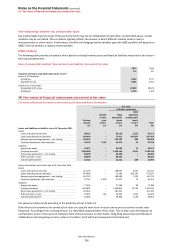
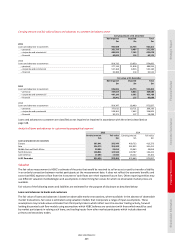
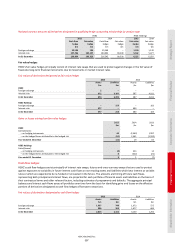
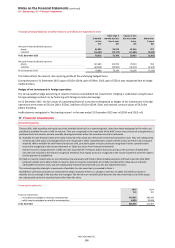
13 – Fair values of financial instruments carried at fair value
Quantitative information about significant unobservable inputs in Level 3 valuations (continued)
Fair value Key unobservable
Assets Liabilities Valuation technique inputs Full range of inputs Core range of inputs
$m $m Lower Higher Lower Higher
Private equity including strategic investments 3,716 47 See notes on page 389 See notes on page 389 n/a n/a n/a n/a
Asset-backed securities 2,078
–
–
CLO/CDO1 1,122
–
Model
–
Discounted cash flow Prepayment rate 1% 6% 1% 6%
Market proxy Bid quotes 0100 54 85
Other ABSs 956
–
Loans held for securitisation 39
–
Structured notes 26,092
–
equity-linked notes
–
4,744 Model
–
Option model Equity volatility 0.2% 65% 18% 38%
Model
–
Option model Equity correlation 27% 92% 44% 79%
–
fund-linked notes
–
562 Model
–
Option model Fund volatility 6% 8% 6% 8%
–
FX-linked notes 2477 Model
–
Option model FX volatility 2% 70% 4% 16%
–
other
–
309
Derivatives with monolines 239 1Model
–
Discounted cash flow Credit spread 3% 5% 4% 4%
Other derivatives 2,685 1,906
Interest rate derivatives:
–
securitisation swaps 449 1,023 Model
–
Discounted cash flow Prepayment rate 0% 50% 6% 18%
–
long-dated swaptions 1,044 152 Model
–
Option model IR volatility 2% 59% 16% 36%
–
other 755 151
FX derivatives:
–
FX options 89 95 Model
–
Option model FX volatility 0.1% 70% 4% 14%
–
other 7 7
Equity derivatives:
–
long-dated single stock options 192 256 Model
–
Option model Equity volatility 9% 65% 16% 40%
–
other 34 162
Credit derivatives:
–
other 115 60
Other portfolios 6,347
–
–
structured certificates 4,420
–
Model
–
Discounted cash flow Credit volatility 0.8% 3% 0.8% 3%
–
EM corporate debt 372
–
Market proxy Credit spread 1% 4% 1% 3%
Market proxy Bid quotes 58 131 106 130
–
other2 1,555
–
At 31 December 2014 15,106 8,046
1 Collateralised loan obligation/collateralised debt obligation.
2 Includes a range of smaller asset holdings.