HSBC 2015 Annual Report Download - page 177
Download and view the complete annual report
Please find page 177 of the 2015 HSBC annual report below. You can navigate through the pages in the report by either clicking on the pages listed below, or by using the keyword search tool below to find specific information within the annual report.-
 1
1 -
2
-
3
-
4
-
5
-
6
-
7
-
8
-
9
-
10
-
11
-
12
-
13
-
14
-
15
-
16
-
17
-
18
-
19
-
20
-
21
-
22
-
23
-
24
-
25
-
26
-
27
-
28
-
29
-
30
-
31
-
32
-
33
-
34
-
35
-
36
-
37
-
38
-
39
-
40
-
41
-
42
-
43
-
44
-
45
-
46
-
47
-
48
-
49
-
50
-
51
-
52
-
53
-
54
-
55
-
56
-
57
-
58
-
59
-
60
-
61
-
62
-
63
-
64
-
65
-
66
-
67
-
68
-
69
-
70
-
71
-
72
-
73
-
74
-
75
-
76
-
77
-
78
-
79
-
80
-
81
-
82
-
83
-
84
-
85
-
86
-
87
-
88
-
89
-
90
-
91
-
92
-
93
-
94
-
95
-
96
-
97
-
98
-
99
-
100
-
101
-
102
-
103
-
104
-
105
-
106
-
107
-
108
-
109
-
110
-
111
-
112
-
113
-
114
-
115
-
116
-
117
-
118
-
119
-
120
-
121
-
122
-
123
-
124
-
125
-
126
-
127
-
128
-
129
-
130
-
131
-
132
-
133
-
134
-
135
-
136
-
137
-
138
-
139
-
140
-
141
-
142
-
143
-
144
-
145
-
146
-
147
-
148
-
149
-
150
-
151
-
152
-
153
-
154
-
155
-
156
-
157
-
158
-
159
-
160
-
161
-
162
-
163
-
164
-
165
-
166
-
 167
167 -
 168
168 -
 169
169 -
 170
170 -
 171
171 -
 172
172 -
 173
173 -
 174
174 -
 175
175 -
 176
176 -
 177
177 -
 178
178 -
 179
179 -
 180
180 -
 181
181 -
 182
182 -
 183
183 -
 184
184 -
 185
185 -
 186
186 -
 187
187 -
188
-
189
-
190
-
191
-
192
-
193
-
194
-
195
-
196
-
197
-
198
-
199
-
200
-
201
-
202
-
203
-
204
-
205
-
206
-
207
-
208
-
209
-
210
-
211
-
212
-
213
-
214
-
215
-
216
-
217
-
218
-
219
-
220
-
221
-
222
-
223
-
224
-
225
-
226
-
227
-
228
-
229
-
230
-
231
-
232
-
233
-
234
-
235
-
236
-
237
-
238
-
239
-
240
-
241
-
242
-
243
-
244
-
245
-
246
-
247
-
248
-
249
-
250
-
251
-
252
-
253
-
254
-
255
-
256
-
257
-
258
-
259
-
260
-
261
-
262
-
263
-
264
-
265
-
266
-
267
-
268
-
269
-
270
-
271
-
272
-
273
-
274
-
275
-
276
-
277
-
278
-
279
-
280
-
281
-
282
-
283
-
284
-
285
-
286
-
287
-
288
-
289
-
290
-
291
-
292
-
293
-
294
-
295
-
296
-
297
-
298
-
299
-
300
-
301
-
302
-
303
-
304
-
305
-
306
-
307
-
308
-
309
-
310
-
311
-
312
-
313
-
314
-
315
-
316
-
317
-
318
-
319
-
320
-
321
-
322
-
323
-
324
-
325
-
326
-
327
-
328
-
329
-
330
-
331
-
332
-
333
-
334
-
335
-
336
-
337
-
338
-
339
-
340
-
341
-
342
-
343
-
344
-
345
-
346
-
347
-
348
-
349
-
350
-
351
-
352
-
353
-
354
-
355
-
356
-
357
-
358
-
359
-
360
-
361
-
362
-
363
-
364
-
365
-
366
-
367
-
368
-
369
-
370
-
371
-
372
-
373
-
374
-
375
-
376
-
377
-
378
-
379
-
380
-
381
-
382
-
383
-
384
-
385
-
386
-
387
-
388
-
389
-
390
-
391
-
392
-
393
-
394
-
395
-
396
-
397
-
398
-
399
-
400
-
401
-
402
-
403
-
404
-
405
-
406
-
407
-
408
-
409
-
410
-
411
-
412
-
413
-
414
-
415
-
416
-
417
-
418
-
419
-
420
-
421
-
422
-
423
-
424
-
425
-
426
-
427
-
428
-
429
-
430
-
431
-
432
-
433
-
434
-
435
-
436
-
437
-
438
-
439
-
440
-
441
-
442
-
443
-
444
-
445
-
446
-
447
-
448
-
449
-
450
-
451
-
452
-
453
-
454
-
455
-
456
-
457
-
458
-
459
-
460
-
461
-
462
-
463
-
464
-
465
-
466
-
467
-
468
-
469
-
470
-
471
-
472
-
473
-
474
-
475
-
476
-
477
-
478
-
479
-
480
-
481
-
482
-
483
-
484
-
485
-
486
-
487
-
488
-
489
-
490
-
491
-
492
-
493
-
494
-
495
-
496
-
497
-
498
-
499
-
500
-
501
-
502
 |
 |

HSBC HOLDINGS PLC
175
Strategic Report Financial Review Corporate Governance Financial Statements Shareholder Information
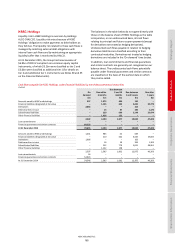
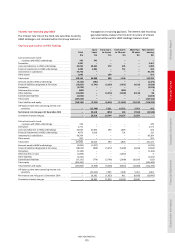
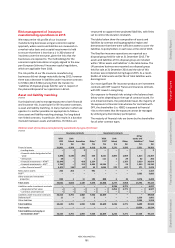
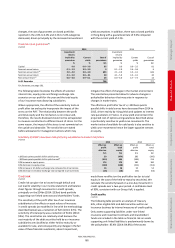
Interest rate repricing gap table
The interest rate risk on the fixed-rate securities issued by
HSBC Holdings is not included within the Group VaR but is
managed on a re-pricing gap basis. The interest rate re-pricing
gap table below analyses the full-term structure of interest
rate mismatches within HSBC Holdings’ balance sheet.
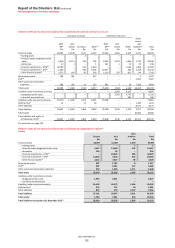
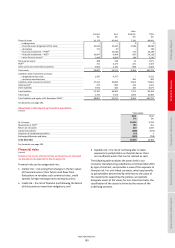
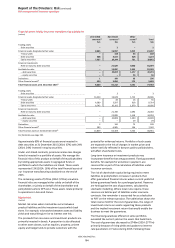
Repricing gap analysis of HSBC Holdings
Total
Up to
1 year
From over 1
to 5 years
From over 5
to 10 years
More than
10 years
Non-interest
bearing
$m $m $m $m $m $m
Cash at bank and in hand:
–
balances with HSBC undertakings 242 242
–
–
–
–
Derivatives 2,467
–
–
–
–
2,467
Loans and advances to HSBC undertakings 44,350 42,661 279 405
–
1,005
Financial investments in HSBC undertakings 4,285 2,985
–
731
–
569
Investments in subsidiaries 97,770
–
–
–
–
97,770
Other assets 1,080
–
109
–
–
971
Total assets 150,194 45,888 388 1,136 102,782
Amounts owed to HSBC undertakings (2,152) (781)
–
–
–
(1,371)
Financial liabilities designated at fair values (19,853) (1,741) (3,239) (7,032) (4,312) (3,628)
Derivatives (2,278)
–
–
–
–
(2,278)
Debt securities in issue (960)
–
–
(963)
–
3
Other liabilities (15,895)
–
(3,374) (3,500) (9,119) 98
Subordinated liabilities (1,642)
–
–
–
–
(1,642)
Total equity (107,414)
–
–
–
–
(107,414)
Total liabilities and equity (150,194) (2,522) (6,613) (11,495) (13,332) (116,232)
Off-balance sheet items attracting interest rate
sensitivity – (22,748) 5,351 10,722 5,763 912
Net interest rate risk gap at 31 December 2015
–
20,618 (874) 363 (7,569) (12,538)
Cumulative interest rate gap
–
20,618 19,744 20,107 12,538
–
Cash at bank and in hand:
–
balances with HSBC undertakings 249
–
–
–
–
249
Derivatives 2,771
–
–
–
–
2,771
Loans and advances to HSBC undertakings 43,910 41,603 290 1,093
–
924
Financial investments in HSBC undertakings 4,073 3,010
–
731
–
332
Investments in subsidiaries 96,264
–
–
–
–
96,264
Other assets 597
–
–
–
–
597
14 8641
Total assets 147,864 44,613 290 1,824
–
101,137
(1
Amounts owed to HSBC undertakings (2,892) (1,877)
–
–
–
(1,015)
Financial liabilities designated at fair values (18,679) (850) (5,472) (5,400) (4,263) (2,694)
Derivatives (1,169)
–
–
–
–
(1,169)
Debt securities in issue (1,009)
–
–
(1,013)
–
4
Other liabilities (1,415)
–
–
–
–
(1,415)
Subordinated liabilities (17,255) (779) (3,766) (2,000) (10,195) (515)
Total equity (105,445)
–
–
–
–
(105,445)
(
Total liabilities and equity (147,864) (3,506) (9,238) (8,413) (14,458) (112,249)
Off-balance sheet items attracting interest rate
sensitivity – (21,525) 7,295 7,400 5,763 1,067
Net interest rate risk gap at 31 December 2014
–
19,582 (1,653) 811 (8,695) (10,045)
Cumulative interest rate gap
–
19,582 17,929 18,740 10,045
–