HSBC 2015 Annual Report Download - page 126
Download and view the complete annual report
Please find page 126 of the 2015 HSBC annual report below. You can navigate through the pages in the report by either clicking on the pages listed below, or by using the keyword search tool below to find specific information within the annual report.-
 1
1 -
2
-
3
-
4
-
5
-
6
-
7
-
8
-
9
-
10
-
11
-
12
-
13
-
14
-
15
-
16
-
17
-
18
-
19
-
20
-
21
-
22
-
23
-
24
-
25
-
26
-
27
-
28
-
29
-
30
-
31
-
32
-
33
-
34
-
35
-
36
-
37
-
38
-
39
-
40
-
41
-
42
-
43
-
44
-
45
-
46
-
47
-
48
-
49
-
50
-
51
-
52
-
53
-
54
-
55
-
56
-
57
-
58
-
59
-
60
-
61
-
62
-
63
-
64
-
65
-
66
-
67
-
68
-
69
-
70
-
71
-
72
-
73
-
74
-
75
-
76
-
77
-
78
-
79
-
80
-
81
-
82
-
83
-
84
-
85
-
86
-
87
-
88
-
89
-
90
-
91
-
92
-
93
-
94
-
95
-
96
-
97
-
98
-
99
-
100
-
101
-
102
-
103
-
104
-
105
-
106
-
107
-
108
-
109
-
110
-
111
-
112
-
113
-
114
-
115
-
 116
116 -
 117
117 -
 118
118 -
 119
119 -
 120
120 -
 121
121 -
 122
122 -
 123
123 -
 124
124 -
 125
125 -
 126
126 -
 127
127 -
 128
128 -
 129
129 -
 130
130 -
 131
131 -
 132
132 -
 133
133 -
 134
134 -
 135
135 -
 136
136 -
137
-
138
-
139
-
140
-
141
-
142
-
143
-
144
-
145
-
146
-
147
-
148
-
149
-
150
-
151
-
152
-
153
-
154
-
155
-
156
-
157
-
158
-
159
-
160
-
161
-
162
-
163
-
164
-
165
-
166
-
167
-
168
-
169
-
170
-
171
-
172
-
173
-
174
-
175
-
176
-
177
-
178
-
179
-
180
-
181
-
182
-
183
-
184
-
185
-
186
-
187
-
188
-
189
-
190
-
191
-
192
-
193
-
194
-
195
-
196
-
197
-
198
-
199
-
200
-
201
-
202
-
203
-
204
-
205
-
206
-
207
-
208
-
209
-
210
-
211
-
212
-
213
-
214
-
215
-
216
-
217
-
218
-
219
-
220
-
221
-
222
-
223
-
224
-
225
-
226
-
227
-
228
-
229
-
230
-
231
-
232
-
233
-
234
-
235
-
236
-
237
-
238
-
239
-
240
-
241
-
242
-
243
-
244
-
245
-
246
-
247
-
248
-
249
-
250
-
251
-
252
-
253
-
254
-
255
-
256
-
257
-
258
-
259
-
260
-
261
-
262
-
263
-
264
-
265
-
266
-
267
-
268
-
269
-
270
-
271
-
272
-
273
-
274
-
275
-
276
-
277
-
278
-
279
-
280
-
281
-
282
-
283
-
284
-
285
-
286
-
287
-
288
-
289
-
290
-
291
-
292
-
293
-
294
-
295
-
296
-
297
-
298
-
299
-
300
-
301
-
302
-
303
-
304
-
305
-
306
-
307
-
308
-
309
-
310
-
311
-
312
-
313
-
314
-
315
-
316
-
317
-
318
-
319
-
320
-
321
-
322
-
323
-
324
-
325
-
326
-
327
-
328
-
329
-
330
-
331
-
332
-
333
-
334
-
335
-
336
-
337
-
338
-
339
-
340
-
341
-
342
-
343
-
344
-
345
-
346
-
347
-
348
-
349
-
350
-
351
-
352
-
353
-
354
-
355
-
356
-
357
-
358
-
359
-
360
-
361
-
362
-
363
-
364
-
365
-
366
-
367
-
368
-
369
-
370
-
371
-
372
-
373
-
374
-
375
-
376
-
377
-
378
-
379
-
380
-
381
-
382
-
383
-
384
-
385
-
386
-
387
-
388
-
389
-
390
-
391
-
392
-
393
-
394
-
395
-
396
-
397
-
398
-
399
-
400
-
401
-
402
-
403
-
404
-
405
-
406
-
407
-
408
-
409
-
410
-
411
-
412
-
413
-
414
-
415
-
416
-
417
-
418
-
419
-
420
-
421
-
422
-
423
-
424
-
425
-
426
-
427
-
428
-
429
-
430
-
431
-
432
-
433
-
434
-
435
-
436
-
437
-
438
-
439
-
440
-
441
-
442
-
443
-
444
-
445
-
446
-
447
-
448
-
449
-
450
-
451
-
452
-
453
-
454
-
455
-
456
-
457
-
458
-
459
-
460
-
461
-
462
-
463
-
464
-
465
-
466
-
467
-
468
-
469
-
470
-
471
-
472
-
473
-
474
-
475
-
476
-
477
-
478
-
479
-
480
-
481
-
482
-
483
-
484
-
485
-
486
-
487
-
488
-
489
-
490
-
491
-
492
-
493
-
494
-
495
-
496
-
497
-
498
-
499
-
500
-
501
-
502
 |
 |

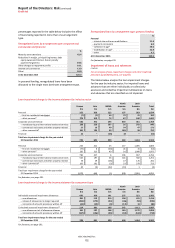
Report of the Directors: Risk (continued)
Credit risk
HSBC HOLDINGS PLC
124
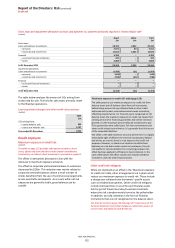
government agency debt securities. We also held assets
backing insurance and investment contracts.
For an analysis of financial investments, see Note 17 on the
Financial Statements.
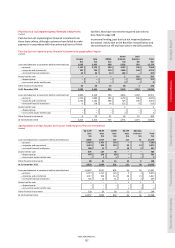
Trading assets
Trading securities remained the largest concentration
within trading assets at 77% in 2015 and 2014. The largest
concentration within the trading securities portfolio was in
government and government agency debt securities. We
had significant exposures to US Treasury and government
agency debt securities ($15bn) and UK ($10bn) and Hong
Kong ($6.5bn) government debt securities.
For an analysis of debt and equity securities held for trading, see
Note 12 on the Financial Statements.
Derivatives
Derivative assets were $288bn at 31 December 2015 (2014:
$345bn). Details of derivative amounts cleared through an
exchange, central counterparty and non-central
counterparty are shown on page 142.
For an analysis of derivatives, see page 141 and Note 16 on the
Financial Statements.
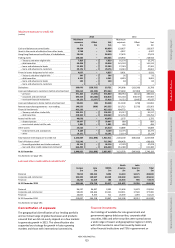
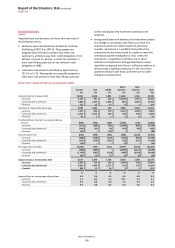
Loans and advances
The following tables analyse loans by industry sector and
by the location of the principal operations of the lending
subsidiary or, in the case of the operations of The
Hongkong and Shanghai Banking Corporation, HSBC Bank,
HSBC Bank Middle East Limited and HSBC Bank USA, by the
location of the lending branch. Excluding the effect of the
classification of Brazilian assets as ‘Assets held for sale’,
the distribution of loans across geographical regions
and industries remained similar to last year.
For an analysis of loans and advances by country see page 151.
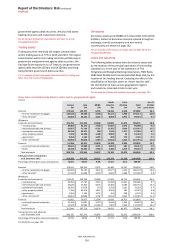
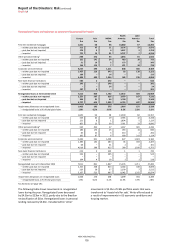
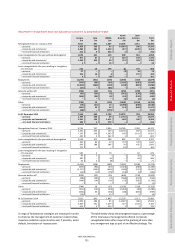
Gross loans and advances by industry sector and by geographical region
(Audited)
Europe Asia MENA
North
America
Latin
America Total
As a %
of total
$m $m $m $m $m $m gross loans
Personal 170,526 132,707 6,705 58,186 5,958 374,082 36.5
–
first lien residential mortgages 125,544 94,606 2,258 50,117 1,986 274,511 26.8
–
other personal3 44,982 38,101 4,447 8,069 3,972 99,571 9.7
Wholesale
Corporate and commercial 191,765 211,224 22,268 62,882 11,374 499,513 48.8
–
manufacturing 39,003 34,272 2,504 17,507 2,572 95,858 9.4
–
international trade and services 62,667 72,199 9,552 11,505 3,096 159,019 15.5
–
commercial real estate 26,256 32,371 690 7,032 1,577 67,926 6.7
–
other property-related 7,323 35,206 1,908 8,982 45 53,464 5.2
–
government 3,653 1,132 1,695 203 772 7,455 0.7
–
other commercial4 52,863 36,044 5,919 17,653 3,312 115,791 11.3
Financial 51,969 68,321 10,239 16,308 3,996 150,833 14.7
–
non-bank financial institutions 33,621 13,969 2,321 9,822 681 60,414 5.9
–
banks 18,348 54,352 7,918 6,486 3,315 90,419 8.8
Total wholesale 243,734 279,545 32,507 79,190 15,370 650,346 63.5
Total gross loans and advances
at 31 December 2015 414,260 412,252 39,212 137,376 21,328 1,024,428 100.0
Percentage of total gross loans and advances 40.4% 40.3% 3.8% 13.4% 2.1% 100.0%
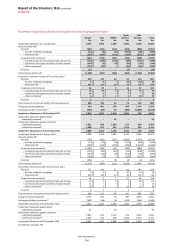
Personal 178,531 129,515 6,571 65,400 13,537 393,554 35.8
–
first lien residential mortgages 131,000 93,147 2,647 55,577 4,153 286,524 26.0
–
other personal3 47,531 36,368 3,924 9,823 9,384 107,030 9.8
Wholesale
Corporate and commercial 212,523 220,799 20,588 57,993 30,722 542,625 49.4
–
manufacturing 39,456 37,767 2,413 15,299 12,051 106,986 9.7
–
international trade and services 76,629 72,814 9,675 13,484 8,189 180,791 16.4
–
commercial real estate 28,187 35,678 579 6,558 2,291 73,293 6.7
–
other property-related 7,126 34,379 1,667 8,934 281 52,387 4.8
–
government 2,264 1,195 1,552 164 968 6,143 0.6
–
other commercial4 58,861 38,966 4,702 13,554 6,942 123,025 11.2
Financial 45,081 76,957 13,786 16,439 10,753 163,016 14.8
–
non-bank financial institutions 23,103 13,997 3,291 9,034 1,393 50,818 4.6
–
banks 21,978 62,960 10,495 7,405 9,360 112,198 10.2
Total wholesale 257,604 297,756 34,374 74,432 41,475 705,641 64.2
Total gross loans and advances
at 31 December 2014 436,135 427,271 40,945 139,832 55,012 1,099,195 100.0
Percentage of total gross loans and advances 39.7% 38.9% 3.7% 12.7% 5.0% 100.0%
For footnotes, see page 191.