HSBC 2015 Annual Report Download - page 119
Download and view the complete annual report
Please find page 119 of the 2015 HSBC annual report below. You can navigate through the pages in the report by either clicking on the pages listed below, or by using the keyword search tool below to find specific information within the annual report.-
 1
1 -
2
-
3
-
4
-
5
-
6
-
7
-
8
-
9
-
10
-
11
-
12
-
13
-
14
-
15
-
16
-
17
-
18
-
19
-
20
-
21
-
22
-
23
-
24
-
25
-
26
-
27
-
28
-
29
-
30
-
31
-
32
-
33
-
34
-
35
-
36
-
37
-
38
-
39
-
40
-
41
-
42
-
43
-
44
-
45
-
46
-
47
-
48
-
49
-
50
-
51
-
52
-
53
-
54
-
55
-
56
-
57
-
58
-
59
-
60
-
61
-
62
-
63
-
64
-
65
-
66
-
67
-
68
-
69
-
70
-
71
-
72
-
73
-
74
-
75
-
76
-
77
-
78
-
79
-
80
-
81
-
82
-
83
-
84
-
85
-
86
-
87
-
88
-
89
-
90
-
91
-
92
-
93
-
94
-
95
-
96
-
97
-
98
-
99
-
100
-
101
-
102
-
103
-
104
-
105
-
106
-
107
-
108
-
 109
109 -
 110
110 -
 111
111 -
 112
112 -
 113
113 -
 114
114 -
 115
115 -
 116
116 -
 117
117 -
 118
118 -
 119
119 -
 120
120 -
 121
121 -
 122
122 -
 123
123 -
 124
124 -
 125
125 -
 126
126 -
 127
127 -
 128
128 -
 129
129 -
130
-
131
-
132
-
133
-
134
-
135
-
136
-
137
-
138
-
139
-
140
-
141
-
142
-
143
-
144
-
145
-
146
-
147
-
148
-
149
-
150
-
151
-
152
-
153
-
154
-
155
-
156
-
157
-
158
-
159
-
160
-
161
-
162
-
163
-
164
-
165
-
166
-
167
-
168
-
169
-
170
-
171
-
172
-
173
-
174
-
175
-
176
-
177
-
178
-
179
-
180
-
181
-
182
-
183
-
184
-
185
-
186
-
187
-
188
-
189
-
190
-
191
-
192
-
193
-
194
-
195
-
196
-
197
-
198
-
199
-
200
-
201
-
202
-
203
-
204
-
205
-
206
-
207
-
208
-
209
-
210
-
211
-
212
-
213
-
214
-
215
-
216
-
217
-
218
-
219
-
220
-
221
-
222
-
223
-
224
-
225
-
226
-
227
-
228
-
229
-
230
-
231
-
232
-
233
-
234
-
235
-
236
-
237
-
238
-
239
-
240
-
241
-
242
-
243
-
244
-
245
-
246
-
247
-
248
-
249
-
250
-
251
-
252
-
253
-
254
-
255
-
256
-
257
-
258
-
259
-
260
-
261
-
262
-
263
-
264
-
265
-
266
-
267
-
268
-
269
-
270
-
271
-
272
-
273
-
274
-
275
-
276
-
277
-
278
-
279
-
280
-
281
-
282
-
283
-
284
-
285
-
286
-
287
-
288
-
289
-
290
-
291
-
292
-
293
-
294
-
295
-
296
-
297
-
298
-
299
-
300
-
301
-
302
-
303
-
304
-
305
-
306
-
307
-
308
-
309
-
310
-
311
-
312
-
313
-
314
-
315
-
316
-
317
-
318
-
319
-
320
-
321
-
322
-
323
-
324
-
325
-
326
-
327
-
328
-
329
-
330
-
331
-
332
-
333
-
334
-
335
-
336
-
337
-
338
-
339
-
340
-
341
-
342
-
343
-
344
-
345
-
346
-
347
-
348
-
349
-
350
-
351
-
352
-
353
-
354
-
355
-
356
-
357
-
358
-
359
-
360
-
361
-
362
-
363
-
364
-
365
-
366
-
367
-
368
-
369
-
370
-
371
-
372
-
373
-
374
-
375
-
376
-
377
-
378
-
379
-
380
-
381
-
382
-
383
-
384
-
385
-
386
-
387
-
388
-
389
-
390
-
391
-
392
-
393
-
394
-
395
-
396
-
397
-
398
-
399
-
400
-
401
-
402
-
403
-
404
-
405
-
406
-
407
-
408
-
409
-
410
-
411
-
412
-
413
-
414
-
415
-
416
-
417
-
418
-
419
-
420
-
421
-
422
-
423
-
424
-
425
-
426
-
427
-
428
-
429
-
430
-
431
-
432
-
433
-
434
-
435
-
436
-
437
-
438
-
439
-
440
-
441
-
442
-
443
-
444
-
445
-
446
-
447
-
448
-
449
-
450
-
451
-
452
-
453
-
454
-
455
-
456
-
457
-
458
-
459
-
460
-
461
-
462
-
463
-
464
-
465
-
466
-
467
-
468
-
469
-
470
-
471
-
472
-
473
-
474
-
475
-
476
-
477
-
478
-
479
-
480
-
481
-
482
-
483
-
484
-
485
-
486
-
487
-
488
-
489
-
490
-
491
-
492
-
493
-
494
-
495
-
496
-
497
-
498
-
499
-
500
-
501
-
502
 |
 |

HSBC HOLDINGS PLC
117
Strategic Report Financial Review Corporate Governance Financial Statements Shareholder Information
Other entities in the Group, including The Hongkong
and Shanghai Banking Corporation Limited and HSBC Bank
plc, continue to participate in regulatory stress tests
conducted at a subsidiary level by local regulators.
In October 2015, the BoE published details of its medium-
term approach to stress testing the UK banking system. Key
features of the approach include an annual cyclical stress
test and a biennial exploratory stress test, starting in 2017.
The EBA plan to conduct stress tests in 2016. Details of their
proposed approach were published by them in November
2015.
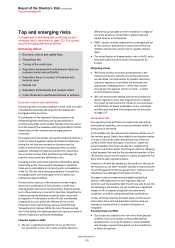
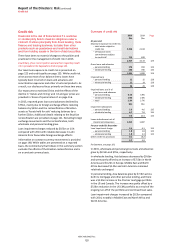
Oil and gas prices
Oil and commodity prices have remained low since the
middle of 2014 as a result of existing global supply and
demand imbalances, with significant price declines in late
2015 and early 2016. Continued lower oil prices cause
increased credit risks within oil-related industries together
with fiscal and financing challenges for energy exporters.
The overall portfolio of exposures directly exposed to oil and
gas companies had drawn risk exposures amounting to
about $29bn (2014: $34bn) with sub-sectoral distributions as
follows: integrated producers 48%, service companies 28%,
pure producers 17% and infrastructure companies 7%.
The credit quality distribution of the oil and gas portfolio was
as follows: ‘strong’ and ‘good’ categories made up 56% of
the portfolio, ‘satisfactory’ 35%, ‘sub-standard’ 7% and
‘impaired’ 2%. The majority of the exposures were located in
North America, Asia and Europe.
Oil and gas related counterparties have responded rapidly to
the changing economic outlook, cutting back on capital
expenditure as well as reducing operating expenses in order
to manage cash flows and sustain profitability.
Large integrated producers remained resilient. Within the
pure producers sector, the higher cost entities such as shale
and oil sands producers showed more evidence of stress,
resulting in credit grade deterioration. Similarly, service
companies continued to be more vulnerable as producers
curtailed capital expenditures.
Individually assessed loan impairment charges in 2015
remained contained at approximately $0.3bn. Oil prices are
now predicted to remain lower for longer and the oil price
recovery is dependent on the removal of the excess supply
that currently exists in the market. In view of these factors
collective allowances for exposures related to oil and gas
were increased by $0.2bn at the end of the year. Total
allowances in respect of the oil and gas portfolio were
$0.6bn.
The sector remains under enhanced monitoring with risk
appetite and new lending has been significantly curtailed.
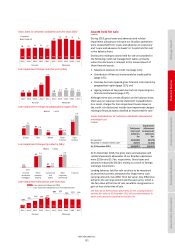
Metals and mining
Metals prices declined during 2015 although the pace and
extent of the price decline was more gradual than for oil
and gas.
Precious metals, copper, nickel and zinc prices are generally
forecast to improve slightly in 2016. The outlook for steel,
aluminium and bulk metals is more negative due to a
combination of oversupply and reduction in demand. The
low oil and gas prices benefit most metals and mining
customers given that they are large consumers of energy.
Our total drawn risk exposure to metals and mining was
$18bn (steel and aluminium $9bn, copper, nickel and zinc
$4bn, iron ore and metallurgical coal $3bn, precious metals
$2bn). Individually assessed loan impairments were $0.1bn.
Given the pressures in metals prices the metals and mining
sector is under heightened management review.
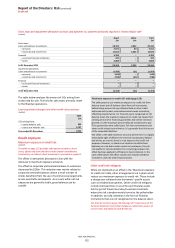
Mainland China exposures
Mainland China’s economic growth rate slowed in 2014 and
2015 with a gross domestic product of 6.9% in 2015
compared with 7.3% in 2014 (2013: 7.7%). China’s economic
growth rate remains very strong when compared with
developed western economies. Although the largest foreign
bank in China, HSBC’s overall lending market share is very
small at about 0.2%. This allows us to be selective in our
lending to mainland China-related exposures, targeting high
quality lending centred around specific priority sectors.
The portfolio has continued to perform well with loan
impairment charges remaining at their existing low levels.
The total mainland China portfolio had drawn risk exposures
of $143bn, of which $77bn was booked onshore, with the
remainder mainly booked in Hong Kong. Retail lending
amounted to $8bn, focused primarily on residential
mortgages in selected geographical areas. Wholesale lending
amounted to $135bn. 51% of the wholesale portfolio was
corporate lending with 26% to banks and the remainder to
China sovereign. The lending to banks was 99% investment
grade. The corporate portfolio was also of high quality with
62% of the portfolio of investment grade. Only 2% of the
corporate portfolio was rated substandard which compares
favourably with the Group as a whole. The corporate
portfolio was well diversified with less than 40% of lending to
state owned enterprises. The corporate real estate portfolio
amounted to about $15bn. This portfolio which is primarily
focused on tier 1 and tier 2 cities and the Pearl River Delta,
was managed carefully under a series of caps ensuring that
the lending to this sector remained within our risk appetite.
Our resultant ability to be selective in our lending and apply
our traditionally strong underwriting standards means we
have a high quality portfolio which we would expect to be
resilient even in a situation where mainland China’s growth
rate slows further.