HSBC 2015 Annual Report Download - page 127
Download and view the complete annual report
Please find page 127 of the 2015 HSBC annual report below. You can navigate through the pages in the report by either clicking on the pages listed below, or by using the keyword search tool below to find specific information within the annual report.-
 1
1 -
2
-
3
-
4
-
5
-
6
-
7
-
8
-
9
-
10
-
11
-
12
-
13
-
14
-
15
-
16
-
17
-
18
-
19
-
20
-
21
-
22
-
23
-
24
-
25
-
26
-
27
-
28
-
29
-
30
-
31
-
32
-
33
-
34
-
35
-
36
-
37
-
38
-
39
-
40
-
41
-
42
-
43
-
44
-
45
-
46
-
47
-
48
-
49
-
50
-
51
-
52
-
53
-
54
-
55
-
56
-
57
-
58
-
59
-
60
-
61
-
62
-
63
-
64
-
65
-
66
-
67
-
68
-
69
-
70
-
71
-
72
-
73
-
74
-
75
-
76
-
77
-
78
-
79
-
80
-
81
-
82
-
83
-
84
-
85
-
86
-
87
-
88
-
89
-
90
-
91
-
92
-
93
-
94
-
95
-
96
-
97
-
98
-
99
-
100
-
101
-
102
-
103
-
104
-
105
-
106
-
107
-
108
-
109
-
110
-
111
-
112
-
113
-
114
-
115
-
116
-
 117
117 -
 118
118 -
 119
119 -
 120
120 -
 121
121 -
 122
122 -
 123
123 -
 124
124 -
 125
125 -
 126
126 -
 127
127 -
 128
128 -
 129
129 -
 130
130 -
 131
131 -
 132
132 -
 133
133 -
 134
134 -
 135
135 -
 136
136 -
 137
137 -
138
-
139
-
140
-
141
-
142
-
143
-
144
-
145
-
146
-
147
-
148
-
149
-
150
-
151
-
152
-
153
-
154
-
155
-
156
-
157
-
158
-
159
-
160
-
161
-
162
-
163
-
164
-
165
-
166
-
167
-
168
-
169
-
170
-
171
-
172
-
173
-
174
-
175
-
176
-
177
-
178
-
179
-
180
-
181
-
182
-
183
-
184
-
185
-
186
-
187
-
188
-
189
-
190
-
191
-
192
-
193
-
194
-
195
-
196
-
197
-
198
-
199
-
200
-
201
-
202
-
203
-
204
-
205
-
206
-
207
-
208
-
209
-
210
-
211
-
212
-
213
-
214
-
215
-
216
-
217
-
218
-
219
-
220
-
221
-
222
-
223
-
224
-
225
-
226
-
227
-
228
-
229
-
230
-
231
-
232
-
233
-
234
-
235
-
236
-
237
-
238
-
239
-
240
-
241
-
242
-
243
-
244
-
245
-
246
-
247
-
248
-
249
-
250
-
251
-
252
-
253
-
254
-
255
-
256
-
257
-
258
-
259
-
260
-
261
-
262
-
263
-
264
-
265
-
266
-
267
-
268
-
269
-
270
-
271
-
272
-
273
-
274
-
275
-
276
-
277
-
278
-
279
-
280
-
281
-
282
-
283
-
284
-
285
-
286
-
287
-
288
-
289
-
290
-
291
-
292
-
293
-
294
-
295
-
296
-
297
-
298
-
299
-
300
-
301
-
302
-
303
-
304
-
305
-
306
-
307
-
308
-
309
-
310
-
311
-
312
-
313
-
314
-
315
-
316
-
317
-
318
-
319
-
320
-
321
-
322
-
323
-
324
-
325
-
326
-
327
-
328
-
329
-
330
-
331
-
332
-
333
-
334
-
335
-
336
-
337
-
338
-
339
-
340
-
341
-
342
-
343
-
344
-
345
-
346
-
347
-
348
-
349
-
350
-
351
-
352
-
353
-
354
-
355
-
356
-
357
-
358
-
359
-
360
-
361
-
362
-
363
-
364
-
365
-
366
-
367
-
368
-
369
-
370
-
371
-
372
-
373
-
374
-
375
-
376
-
377
-
378
-
379
-
380
-
381
-
382
-
383
-
384
-
385
-
386
-
387
-
388
-
389
-
390
-
391
-
392
-
393
-
394
-
395
-
396
-
397
-
398
-
399
-
400
-
401
-
402
-
403
-
404
-
405
-
406
-
407
-
408
-
409
-
410
-
411
-
412
-
413
-
414
-
415
-
416
-
417
-
418
-
419
-
420
-
421
-
422
-
423
-
424
-
425
-
426
-
427
-
428
-
429
-
430
-
431
-
432
-
433
-
434
-
435
-
436
-
437
-
438
-
439
-
440
-
441
-
442
-
443
-
444
-
445
-
446
-
447
-
448
-
449
-
450
-
451
-
452
-
453
-
454
-
455
-
456
-
457
-
458
-
459
-
460
-
461
-
462
-
463
-
464
-
465
-
466
-
467
-
468
-
469
-
470
-
471
-
472
-
473
-
474
-
475
-
476
-
477
-
478
-
479
-
480
-
481
-
482
-
483
-
484
-
485
-
486
-
487
-
488
-
489
-
490
-
491
-
492
-
493
-
494
-
495
-
496
-
497
-
498
-
499
-
500
-
501
-
502
 |
 |

HSBC HOLDINGS PLC
125
Strategic Report Financial Review Corporate Governance Financial Statements Shareholder Information
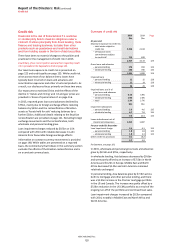
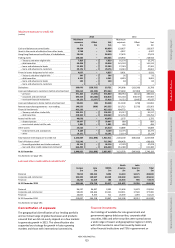
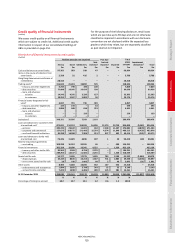
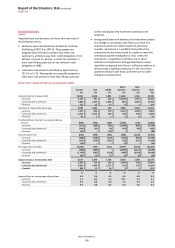
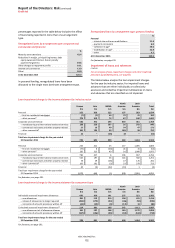
Credit quality of financial instruments
(Audited)
We assess credit quality on all financial instruments
which are subject to credit risk. Additional credit quality
information in respect of our consolidated holdings of
ABSs is provided on page 153.
For the purpose of the following disclosure, retail loans
which are past due up to 90 days and are not otherwise
classified as impaired in accordance with our disclosure
convention are not disclosed within the expected loss
grade to which they relate, but are separately classified
as past due but not impaired.
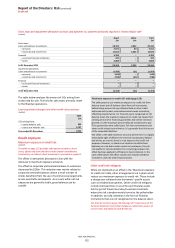
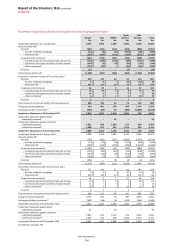
Distribution of financial instruments by credit quality
(Audited)
Neither past due nor impaired Past due
but not
impaired Impaired
Total
gross
amount
Total Strong
Good Satisfactory
Sub-
standard
Impairment
allowances5
$m $m $m $m $m $m $m $m $m
Cash and balances at central banks 97,365 583 939 47
–
–
98,934 98,934
Items in the course of collection from
other banks 5,318 32 416 2
–
–
5,768 5,768
Hong Kong Government certificates of
indebtedness 28,410
–
–
–
–
–
28,410 28,410
Trading assets6 116,633 21,243 19,894 576 158,346 158,346
–
treasury and other eligible bills 6,749 790 190 100 7,829 7,829
–
debt securities 77,088 10,995 10,656 299 99,038 99,038
–
loans and advances:
to banks 14,546 4,391 3,239 127 22,303 22,303
to customers 18,250 5,067 5,809 50 29,176 29,176
Financial assets designated at fair
value6 3,037 701 736 383 4,857 4,857
–
treasury and other eligible bills 139 193
–
64 396 396
–
debt securities 2,898 508 616 319 4,341 4,341
–
loans and advances:
to banks
–
–
120
–
120 120
to customers
–
–
–
–
–
–
Derivatives6 248,101 32,056 7,209 1,110 288,476 288,476
Loans and advances to customers held
at amortised cost7 472,691 214,152 194,393 16,836 12,179 23,758 934,009 (9,555) 924,454
–
personal 309,720 29,322 15,021 944 7,568 11,507 374,082 (2,879) 371,203
–
corporate and commercial 127,673 168,772 171,466 15,379 4,274 11,949 499,513 (6,435) 493,078
–
non-bank financial institutions 35,298 16,058 7,906 513 337 302 60,414 (241) 60,173
Loans and advances to banks held
at amortised cost 73,226 11,929 4,836 407 120 90,419 (18) 90,401
Reverse repurchase agreements
–
non-trading 108,238 16,552 20,931 46
–
488 146,255
–
146,255
Financial investments 382,328 18,600 16,341 4,525
–
1,326 423,120 423,120
–
treasury and other similar bills 93,562 3,963 4,756 2,270
–
–
104,551 104,551
–
debt securities 288,766 14,637 11,585 2,255
–
1,326 318,569 318,569
Assets held for sale 10,177 9,605 17,279 1,635 703 2,133 41,532 (1,454) 40,078
–
disposal groups 10,149 8,815 16,213 1,567 701 2,085 39,530 (1,433) 38,097
–
non-current assets held for sale 28 790 1,066 68 248 2,002 (21) 1,981
Other assets 8,306 5,688 10,204 632 147 333 25,310
–
25,310
–
endorsements and acceptances 1,084 3,850 3,798 343 22 52 9,149 9,149
–
accrued income and other 7,222 1,838 6,406 289 125 281 16,161 16,161
At 31 December 2015 1,553,830 331,141 293,178 26,199 13,030 28,058 2,245,436 (11,027) 2,234,409
% % %%%%%
Percentage of total gross amount 69.2 14.7 13.1 1.2 0.6 1.2 100.0