Dollar General 2009 Annual Report Download - page 90
Download and view the complete annual report
Please find page 90 of the 2009 Dollar General annual report below. You can navigate through the pages in the report by either clicking on the pages listed below, or by using the keyword search tool below to find specific information within the annual report.-
 1
1 -
2
-
3
-
4
-
5
-
6
-
7
-
8
-
9
-
10
-
11
-
12
-
13
-
14
-
15
-
16
-
17
-
18
-
19
-
20
-
21
-
22
-
23
-
24
-
25
-
26
-
27
-
28
-
29
-
30
-
31
-
32
-
33
-
34
-
35
-
36
-
37
-
38
-
39
-
40
-
41
-
42
-
43
-
44
-
45
-
46
-
47
-
48
-
49
-
50
-
51
-
52
-
53
-
54
-
55
-
56
-
57
-
58
-
59
-
60
-
61
-
62
-
63
-
64
-
65
-
66
-
67
-
68
-
69
-
70
-
71
-
72
-
73
-
74
-
75
-
76
-
77
-
78
-
79
-
 80
80 -
 81
81 -
 82
82 -
 83
83 -
 84
84 -
 85
85 -
 86
86 -
 87
87 -
 88
88 -
 89
89 -
 90
90 -
 91
91 -
 92
92 -
 93
93 -
 94
94 -
 95
95 -
 96
96 -
 97
97 -
 98
98 -
 99
99 -
 100
100 -
101
-
102
-
103
-
104
-
105
-
106
-
107
-
108
-
109
-
110
-
111
-
112
-
113
-
114
-
115
-
116
-
117
-
118
-
119
-
120
-
121
-
122
-
123
-
124
-
125
-
126
-
127
-
128
-
129
-
130
-
131
 |
 |

DOLLAR GENERAL CORPORATION AND SUBSIDIARIES
NOTES TO CONSOLIDATED FINANCIAL STATEMENTS (Continued)
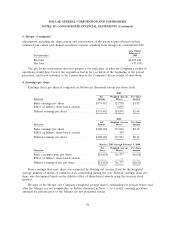
4. Earnings per share (Continued)
Options to purchase shares of common stock that were outstanding at the end of the respective
periods, but were not included in the computation of diluted earnings (loss) per share because the
effect of exercising such options would be antidilutive, were 0.2 million, 12.1 million and 12.5 million in
2009, 2008 and the 2007 Successor period, respectively.
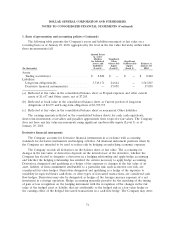
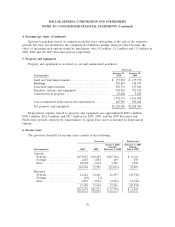
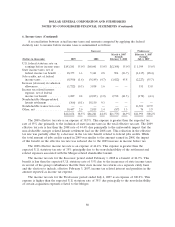
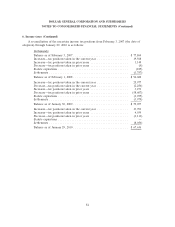
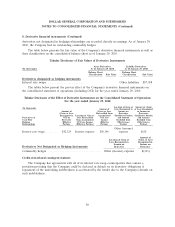
5. Property and equipment
Property and equipment is recorded at cost and summarized as follows:
Successor
January 29, January 30,
(In thousands) 2010 2009
Land and land improvements ...................... $ 137,903 $ 137,779
Buildings ..................................... 520,867 518,933
Leasehold improvements ......................... 130,774 117,846
Furniture, fixtures and equipment ................... 992,423 781,425
Construction in progress .......................... 10,406 5,025
1,792,373 1,561,008
Less accumulated depreciation and amortization ........ 463,987 292,048
Net property and equipment ....................... $1,328,386 $1,268,960
Depreciation expense related to property and equipment was approximately $201.1 million,
$190.5 million, $116.9 million, and $83.5 million for 2009, 2008, and the 2007 Successor and
Predecessor periods, respectively. Amortization of capital lease assets is included in depreciation
expense.
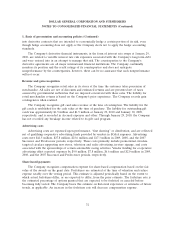
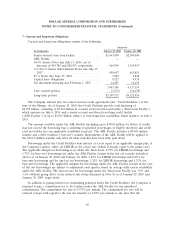
6. Income taxes
The provision (benefit) for income taxes consists of the following:
Successor Predecessor
March 6, 2007 February 3, 2007
through through
(In thousands) 2009 2008 February 1, 2008 July 6, 2007
Current:
Federal ................ $173,027 $10,489 $(25,726) $ 31,114
Foreign ................ 1,465 1,084 409 495
State .................. 21,002 1,214 4,306 1,258
195,494 12,787 (21,011) 32,867
Deferred:
Federal ................ 12,412 64,403 22,157 (18,750)
Foreign ................ (49) (3) — —
State .................. 4,817 9,034 (2,921) (2,124)
17,180 73,434 19,236 (20,874)
$212,674 $86,221 $ (1,775) $ 11,993
79