Dollar General 2009 Annual Report Download - page 73
Download and view the complete annual report
Please find page 73 of the 2009 Dollar General annual report below. You can navigate through the pages in the report by either clicking on the pages listed below, or by using the keyword search tool below to find specific information within the annual report.-
 1
1 -
2
-
3
-
4
-
5
-
6
-
7
-
8
-
9
-
10
-
11
-
12
-
13
-
14
-
15
-
16
-
17
-
18
-
19
-
20
-
21
-
22
-
23
-
24
-
25
-
26
-
27
-
28
-
29
-
30
-
31
-
32
-
33
-
34
-
35
-
36
-
37
-
38
-
39
-
40
-
41
-
42
-
43
-
44
-
45
-
46
-
47
-
48
-
49
-
50
-
51
-
52
-
53
-
54
-
55
-
56
-
57
-
58
-
59
-
60
-
61
-
62
-
 63
63 -
 64
64 -
 65
65 -
 66
66 -
 67
67 -
 68
68 -
 69
69 -
 70
70 -
 71
71 -
 72
72 -
 73
73 -
 74
74 -
 75
75 -
 76
76 -
 77
77 -
 78
78 -
 79
79 -
 80
80 -
 81
81 -
 82
82 -
 83
83 -
84
-
85
-
86
-
87
-
88
-
89
-
90
-
91
-
92
-
93
-
94
-
95
-
96
-
97
-
98
-
99
-
100
-
101
-
102
-
103
-
104
-
105
-
106
-
107
-
108
-
109
-
110
-
111
-
112
-
113
-
114
-
115
-
116
-
117
-
118
-
119
-
120
-
121
-
122
-
123
-
124
-
125
-
126
-
127
-
128
-
129
-
130
-
131
 |
 |

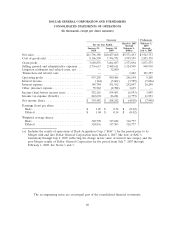
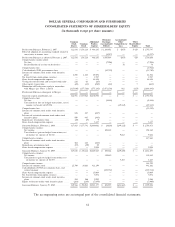
DOLLAR GENERAL CORPORATION AND SUBSIDIARIES
CONSOLIDATED STATEMENTS OF CASH FLOWS
(In thousands)
Successor Predecessor
March 6, 2007 February 3,
For the Year Ended through 2007
January 29, January 30, February 1, through
2010 2009 2008(a) July 6, 2007
Cash flows from operating activities:
Net income (loss) ...................................... $339,442 $ 108,182 $ (4,818) $ (7,998)
Adjustments to reconcile net income (loss) to net cash provided by operating
activities:
Depreciation and amortization ............................. 256,771 247,899 150,213 83,917
Deferred income taxes .................................. 14,860 73,434 19,551 (20,874)
Tax benefit of stock options ............................... (5,390) (950) — (3,927)
Loss (gain) on debt retirement ............................. 55,265 (3,818) 1,249 —
Noncash share-based compensation .......................... 17,295 9,958 3,827 45,433
Noncash inventory adjustments and asset impairments ............... 647 50,671 6,113 —
Other noncash gains and losses ............................. 7,920 6,252 4,276 5,098
Change in operating assets and liabilities:
Merchandise inventories ................................ (100,248) (173,014) 73,356 16,424
Prepaid expenses and other current assets ..................... (7,298) (598) 3,739 (6,184)
Accounts payable .................................... 106,049 140,356 (41,395) 34,794
Accrued expenses and other liabilities ........................ (16,823) 68,736 16,061 52,995
Income taxes ...................................... 1,153 33,986 7,348 2,809
Other .......................................... (1,000) 14,084 84 (541)
Net cash provided by operating activities ......................... 668,643 575,178 239,604 201,946
Cash flows from investing activities:
Merger, net of cash acquired ............................... — — (6,738,391) —
Purchases of property and equipment .......................... (250,747) (205,546) (83,641) (56,153)
Purchases of short-term investments ........................... — (9,903) (3,800) (5,100)
Sales of short-term investments .............................. — 61,547 21,445 9,505
Purchases of long-term investments ............................ — — (44,520) (15,754)
Sale and insurance proceeds related to property and equipment ........... 2,701 1,266 533 620
Net cash used in investing activities ............................ (248,046) (152,636) (6,848,374) (66,882)
Cash flows from financing activities:
Issuance of common stock ................................. 443,753 4,228 2,759,540 —
Net borrowings (repayments) under revolving credit facility .............. — (102,500) 102,500 —
Issuance of long-term obligations ............................. 1,080 — 4,176,817 —
Repayments of long-term obligations ........................... (785,260) (44,425) (241,945) (4,500)
Debt issuance costs ..................................... — — (87,392) —
Payment of cash dividends and related amounts ..................... (239,731) — — (15,710)
Proceeds from exercise of stock options ......................... — — — 41,546
Repurchases of equity ................................... (1,748) (3,009) (541) —
Tax benefit of stock options ................................ 5,390 950 — 3,927
Net cash provided by (used in) financing activities ................... (576,516) (144,756) 6,708,979 25,263
Net increase (decrease) in cash and cash equivalents .................. (155,919) 277,786 100,209 160,327
Cash and cash equivalents, beginning of period ..................... 377,995 100,209 — 189,288
Cash and cash equivalents, end of period ........................ $222,076 $ 377,995 $ 100,209 $349,615
Supplemental cash flow information:
Cash paid (received) for:
Interest ......................................... $328,433 $ 377,022 $ 226,738 $ 11,246
Income taxes ...................................... 187,983 7,091 (30,574) 26,012
Supplemental schedule of noncash investing and financing activities:
Purchases of property and equipment awaiting processing for payment, included in
Accounts payable ..................................... $ 30,393 $ 7,474 $ 20,449 $ 13,544
Purchases of property and equipment under capital lease obligations ........ 50 3,806 592 1,036
Expiration of equity repurchase rights .......................... — 2,548 — —
Exchange of shares and stock options in business combination ............ — — 7,685 —
(a) Includes the cash flows of Buck Acquisition Corp. (‘‘BAC’’) for the period prior to its Merger with and into Dollar General Corporation
from March 6, 2007 (the date of BAC’s formation) through July 6, 2007 (which were zero), and the post-Merger results of Dollar General
Corporation for the period from July 7, 2007 through February 1, 2008. See Notes 1 and 3.
The accompanying notes are an integral part of the consolidated financial statements.
62