Dollar General 2009 Annual Report Download - page 51
Download and view the complete annual report
Please find page 51 of the 2009 Dollar General annual report below. You can navigate through the pages in the report by either clicking on the pages listed below, or by using the keyword search tool below to find specific information within the annual report.-
 1
1 -
2
-
3
-
4
-
5
-
6
-
7
-
8
-
9
-
10
-
11
-
12
-
13
-
14
-
15
-
16
-
17
-
18
-
19
-
20
-
21
-
22
-
23
-
24
-
25
-
26
-
27
-
28
-
29
-
30
-
31
-
32
-
33
-
34
-
35
-
36
-
37
-
38
-
39
-
40
-
 41
41 -
 42
42 -
 43
43 -
 44
44 -
 45
45 -
 46
46 -
 47
47 -
 48
48 -
 49
49 -
 50
50 -
 51
51 -
 52
52 -
 53
53 -
 54
54 -
 55
55 -
 56
56 -
 57
57 -
 58
58 -
 59
59 -
 60
60 -
 61
61 -
62
-
63
-
64
-
65
-
66
-
67
-
68
-
69
-
70
-
71
-
72
-
73
-
74
-
75
-
76
-
77
-
78
-
79
-
80
-
81
-
82
-
83
-
84
-
85
-
86
-
87
-
88
-
89
-
90
-
91
-
92
-
93
-
94
-
95
-
96
-
97
-
98
-
99
-
100
-
101
-
102
-
103
-
104
-
105
-
106
-
107
-
108
-
109
-
110
-
111
-
112
-
113
-
114
-
115
-
116
-
117
-
118
-
119
-
120
-
121
-
122
-
123
-
124
-
125
-
126
-
127
-
128
-
129
-
130
-
131
 |
 |
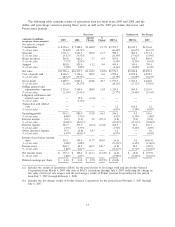
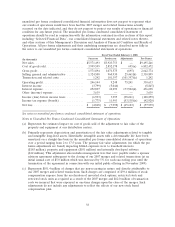
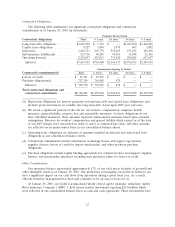
(9) Represents an adjustment to historical interest expense to reflect the effect of the adoption of
current accounting standards for income taxes, offset by capitalized interest expense.
(e) Represents the tax effect of the pro forma adjustments, calculated at an effective rate of 54.1% for
the Predecessor period ended July 6, 2007. The effective tax rate, a benefit, applied to the pro
forma changes for the Predecessor period ended July 6, 2007, reflects the pro forma elimination of
non-deductible transaction costs from income before taxes.
Effects of Inflation
In 2008, increased commodity cost pressures mainly related to food and pet products, which were
driven by fruit and vegetable prices and rising freight costs, increased the costs of certain products.
Increases in petroleum, resin, metals, pulp and other raw material commodity driven costs also resulted
in multiple product cost increases. We believe that our ability to increase selling prices in response to
cost increases largely mitigated the effect of these cost increases on our overall results of operations.
These 2008 trends generally reversed or stabilized in 2009. We believe that inflation and/or deflation
had a minimal impact on our overall operations during 2007.
Liquidity and Capital Resources
Current Financial Condition and Recent Developments
During the past three years, we have generated an aggregate of approximately $1.69 billion in cash
flows from operating activities. During that period, we expanded the number of stores we operate by
599, or over 7%, remodeled or relocated 1,154 stores, or approximately 13% of our currently operated
stores, and incurred approximately $596 million in capital expenditures. We made certain strategic
decisions which slowed our store growth in 2007 and 2008, but we accelerated store growth in 2009 and
currently plan to continue that strategy in 2010 and beyond.
On September 8, 2009, our Board of Directors declared a special dividend on our outstanding
common stock of approximately $239.3 million in the aggregate. The special dividend was paid on
September 11, 2009 to shareholders of record on September 8, 2009 with cash generated from
operations. Prior to our 2007 merger, we declared a quarterly cash dividend in the amount of $0.05 per
share payable on or before April 19, 2007 to common shareholders of record on April 5, 2007. We
have not declared or paid recurring dividends since that date. We have no current plans to pay any
cash dividends on our common stock and instead may retain earnings, if any, for future operation and
expansion and debt repayment. Any decision to declare and pay dividends in the future will be made at
the discretion of our Board of Directors and will depend on, among other things, our results of
operations, cash requirements, financial condition, contractual restrictions and other factors that our
Board of Directors may deem relevant. In addition, our ability to pay dividends is limited by covenants
in our Credit Facilities and in the indentures governing the Notes as discussed in more detail below.
On November 18, 2009, we completed the initial public offering of our common stock. We issued
22,700,000 shares in the offering and an existing shareholder sold an additional 16,515,000 outstanding
shares. Net proceeds from the offering of $446.0 million were used to redeem $195.7 million principal
amount of outstanding Senior Notes and $205.2 million principal amount of outstanding Senior
Subordinated Notes. In connection with the consummation of the offering, we paid a transaction fee of
approximately $4.8 million to KKR and Goldman, Sachs & Co. Although the transaction fee was not
paid from the net proceeds of the offering, this amount was directly related to the offering and was
accounted for as a cost of raising equity. In addition, we terminated our advisory agreement with such
parties, resulting in the payment of a fee of approximately $58.8 million, which was expensed. We also
incurred other pre-tax charges as a result of the offering and related transactions in the fourth quarter
of 2009, as discussed above under ‘‘Results of Operations.’’
40