Dollar General 2009 Annual Report Download - page 2
Download and view the complete annual report
Please find page 2 of the 2009 Dollar General annual report below. You can navigate through the pages in the report by either clicking on the pages listed below, or by using the keyword search tool below to find specific information within the annual report.-
 1
1 -
 2
2 -
 3
3 -
 4
4 -
 5
5 -
 6
6 -
 7
7 -
 8
8 -
 9
9 -
 10
10 -
 11
11 -
 12
12 -
 13
13 -
14
-
15
-
16
-
17
-
18
-
19
-
20
-
21
-
22
-
23
-
24
-
25
-
26
-
27
-
28
-
29
-
30
-
31
-
32
-
33
-
34
-
35
-
36
-
37
-
38
-
39
-
40
-
41
-
42
-
43
-
44
-
45
-
46
-
47
-
48
-
49
-
50
-
51
-
52
-
53
-
54
-
55
-
56
-
57
-
58
-
59
-
60
-
61
-
62
-
63
-
64
-
65
-
66
-
67
-
68
-
69
-
70
-
71
-
72
-
73
-
74
-
75
-
76
-
77
-
78
-
79
-
80
-
81
-
82
-
83
-
84
-
85
-
86
-
87
-
88
-
89
-
90
-
91
-
92
-
93
-
94
-
95
-
96
-
97
-
98
-
99
-
100
-
101
-
102
-
103
-
104
-
105
-
106
-
107
-
108
-
109
-
110
-
111
-
112
-
113
-
114
-
115
-
116
-
117
-
118
-
119
-
120
-
121
-
122
-
123
-
124
-
125
-
126
-
127
-
128
-
129
-
130
-
131
 |
 |

As Reported Adjustments Adjusted (Non-GAAP)
2009 2008 2009 2008 2009 2008
Summary of Operations
Net sales $ 11,796 $ 10,458 $ - $ - $ 11,796 $ 10,458
Gross profit $ 3,690 $ 3,061 $ - $ - $ 3,690 $ 3,061
% of sales 31.3% 29.3% 31.3% 29.3%
Selling, general and
administrative expenses $ 2,737 $ 2,449 ( $ 68) $ - $ 2,668 $ 2,449
% of sales 23.2% 23.4% 22.6% 23.4%
Operating profit $ 953 $ 580 $ 68 $ 32 $ 1,022 $ 613
% of sales 8.1% 5.6% 8.7% 5.9%
Net Income $ 339 $ 108 $ 86 $ 34 $ 425 $ 142
Per Share Results
Diluted earnings per share $ 1.04 $ 0.34 $ 0.26 $ 0.11 $ 1.31 $ 0.45
Financial Position
Total assets $ 8,864 $ 8,889
Long-term obligations,
including current portion $ 3,403 $ 4,137
Shareholders’ equity $ 3,390 $ 2,832
Operating Data
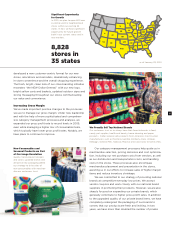
Retail stores at end of year 8,828 8,362
2009 Financial Highlights
Reconciliation of Non-GAAP Financial Measures:
This annual report contains certain adjusted financial measures that are not
computed in accordance with generally accepted accounting principles
(GAAP). Adjustments to selling, general and administrative expenses and
operating profit in 2009 include $59 million relating to the termination of a
sponsor advisory agreement and $9 million resulting from the acceleration of
certain equity-based compensation. The adjustment to operating profit in
2008 relates to the settlement of merger-related litigation. In addition,
adjusted net income excludes amounts related to the early retirement of
long-term obligations (a $55 million loss in 2009 and a $4 million gain in
2008) and the related tax effect of all of these adjustments of $38 million of
expense in 2009 and a $5 million credit in 2008. A reconciliation of adjusted
EBITDA to net income is located on page 45 of the Annual Report on Form
10-K included in this annual report. The Company believes discussion of these
non-GAAP measures provides useful information about the operations of the
Company. These should not be considered a substitute for any measure
computed in accordance with GAAP.
Follow Dollar General at
dollargeneral.com
(In millions, except per share and operating data)