Dollar General 2009 Annual Report Download - page 56
Download and view the complete annual report
Please find page 56 of the 2009 Dollar General annual report below. You can navigate through the pages in the report by either clicking on the pages listed below, or by using the keyword search tool below to find specific information within the annual report.-
 1
1 -
2
-
3
-
4
-
5
-
6
-
7
-
8
-
9
-
10
-
11
-
12
-
13
-
14
-
15
-
16
-
17
-
18
-
19
-
20
-
21
-
22
-
23
-
24
-
25
-
26
-
27
-
28
-
29
-
30
-
31
-
32
-
33
-
34
-
35
-
36
-
37
-
38
-
39
-
40
-
41
-
42
-
43
-
44
-
45
-
 46
46 -
 47
47 -
 48
48 -
 49
49 -
 50
50 -
 51
51 -
 52
52 -
 53
53 -
 54
54 -
 55
55 -
 56
56 -
 57
57 -
 58
58 -
 59
59 -
 60
60 -
 61
61 -
 62
62 -
 63
63 -
 64
64 -
 65
65 -
 66
66 -
67
-
68
-
69
-
70
-
71
-
72
-
73
-
74
-
75
-
76
-
77
-
78
-
79
-
80
-
81
-
82
-
83
-
84
-
85
-
86
-
87
-
88
-
89
-
90
-
91
-
92
-
93
-
94
-
95
-
96
-
97
-
98
-
99
-
100
-
101
-
102
-
103
-
104
-
105
-
106
-
107
-
108
-
109
-
110
-
111
-
112
-
113
-
114
-
115
-
116
-
117
-
118
-
119
-
120
-
121
-
122
-
123
-
124
-
125
-
126
-
127
-
128
-
129
-
130
-
131
 |
 |

required in calculating this covenant ratio under our Credit Facilities. EBITDA and Adjusted EBITDA
are not presentations made in accordance with U.S. GAAP, are not measures of financial performance
or condition, liquidity or profitability, and should not be considered as an alternative to (i) net income,
operating income or any other performance measures determined in accordance with U.S. GAAP or
(ii) operating cash flows determined in accordance with U.S. GAAP. Additionally, EBITDA and
Adjusted EBITDA are not intended to be measures of free cash flow for management’s discretionary
use, as they do not consider certain cash requirements such as interest payments, tax payments and
debt service requirements and replacements of fixed assets.
Our presentation of EBITDA and Adjusted EBITDA has limitations as an analytical tool, and
should not be considered in isolation or as a substitute for analysis of our results as reported under
U.S. GAAP. Because not all companies use identical calculations, these presentations of EBITDA and
Adjusted EBITDA may not be comparable to other similarly titled measures of other companies. We
believe that the presentation of EBITDA and Adjusted EBITDA is appropriate to provide additional
information about the calculation of this financial ratio in the Credit Facilities. Adjusted EBITDA is a
material component of this ratio. Specifically, non-compliance with the senior secured indebtedness
ratio contained in our Credit Facilities could prohibit us from making investments, incurring liens,
making certain restricted payments and incurring additional secured indebtedness (other than the
additional funding provided for under the senior secured credit agreement and pursuant to specified
exceptions).
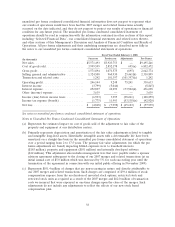
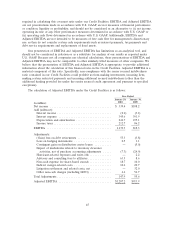
The calculation of Adjusted EBITDA under the Credit Facilities is as follows:
Year Ended
January 29, January 30,
2010 2009
(in millions)
Net income .................................... $ 339.4 $108.2
Add (subtract):
Interest income ................................ (0.1) (3.1)
Interest expense ............................... 345.6 391.9
Depreciation and amortization ..................... 241.7 235.1
Income taxes .................................. 212.7 86.2
EBITDA ...................................... 1,139.3 818.3
Adjustments:
(Gain) loss on debt retirements .................... 55.3 (3.8)
Loss on hedging instruments ...................... 0.5 1.1
Contingent gain on distribution center leases .......... — (5.0)
Impact of markdowns related to inventory clearance
activities, net of purchase accounting adjustments ..... (7.3) (24.9)
Hurricane-related expenses and write-offs ............. — 2.2
Advisory and consulting fees to affiliates .............. 63.5 8.6
Non-cash expense for share-based awards ............. 18.7 10.0
Indirect merger-related costs ...................... 10.6 20.7
Litigation settlement and related costs, net ............ — 32.0
Other non-cash charges (including LIFO) ............. 6.6 54.7
Total Adjustments ................................ 147.9 95.6
Adjusted EBITDA ............................... $1,287.2 $913.9
45