Dollar General 2009 Annual Report Download - page 44
Download and view the complete annual report
Please find page 44 of the 2009 Dollar General annual report below. You can navigate through the pages in the report by either clicking on the pages listed below, or by using the keyword search tool below to find specific information within the annual report.-
 1
1 -
2
-
3
-
4
-
5
-
6
-
7
-
8
-
9
-
10
-
11
-
12
-
13
-
14
-
15
-
16
-
17
-
18
-
19
-
20
-
21
-
22
-
23
-
24
-
25
-
26
-
27
-
28
-
29
-
30
-
31
-
32
-
33
-
 34
34 -
 35
35 -
 36
36 -
 37
37 -
 38
38 -
 39
39 -
 40
40 -
 41
41 -
 42
42 -
 43
43 -
 44
44 -
 45
45 -
 46
46 -
 47
47 -
 48
48 -
 49
49 -
 50
50 -
 51
51 -
 52
52 -
 53
53 -
 54
54 -
55
-
56
-
57
-
58
-
59
-
60
-
61
-
62
-
63
-
64
-
65
-
66
-
67
-
68
-
69
-
70
-
71
-
72
-
73
-
74
-
75
-
76
-
77
-
78
-
79
-
80
-
81
-
82
-
83
-
84
-
85
-
86
-
87
-
88
-
89
-
90
-
91
-
92
-
93
-
94
-
95
-
96
-
97
-
98
-
99
-
100
-
101
-
102
-
103
-
104
-
105
-
106
-
107
-
108
-
109
-
110
-
111
-
112
-
113
-
114
-
115
-
116
-
117
-
118
-
119
-
120
-
121
-
122
-
123
-
124
-
125
-
126
-
127
-
128
-
129
-
130
-
131
 |
 |

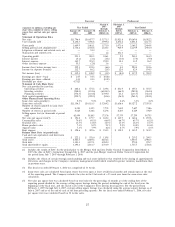
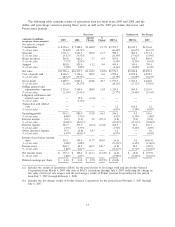
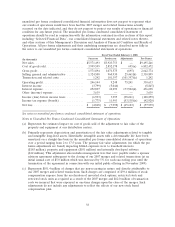
The following table contains results of operations data for fiscal years 2009 and 2008 and the
dollar and percentage variances among those years, as well as the 2007 pro forma, Successor and
Predecessor periods.
Successor Predecessor Pro Forma
Amount %
(amounts in millions, 2009 2008 Change Change 2007(a) 2007(b) 2007
except per share amounts)
Net sales by category:
Consumables ........... $8,356.4 $ 7,248.4 $1,108.0 15.3% $3,701.7 $2,615.1 $6,316.8
% of net sales .......... 70.84% 69.31% 66.44% 66.65% 66.53%
Seasonal .............. 1,711.5 1,521.5 190.0 12.5 908.3 604.9 1,513.2
% of net sales .......... 14.51% 14.55% 16.30% 15.42% 15.94%
Home products ......... 869.8 862.2 7.5 0.9 507.0 362.7 869.8
% of net sales .......... 7.37% 8.24% 9.10% 9.24% 9.16%
Apparel .............. 858.8 825.6 33.2 4.0 454.4 341.0 795.4
% of net sales .......... 7.28% 7.89% 8.16% 8.69% 8.38%
Net sales ............. $11,796.4 $10,457.7 $1,338.7 12.8% $5,571.5 $3,923.8 $9,495.2
Cost of goods sold ....... 8,106.5 7,396.6 709.9 9.6 3,999.6 2,852.2 6,852.5
% of net sales .......... 68.72% 70.73% 71.79% 72.69% 72.17%
Gross profit ........... 3,689.9 3,061.1 628.8 20.5 1,571.9 1,071.6 2,642.8
% of net sales .......... 31.28% 29.27% 28.21% 27.31% 27.83%
Selling, general and
administrative expenses . . 2,736.6 2,448.6 288.0 11.8 1,324.5 960.9 2,310.9
% of net sales .......... 23.20% 23.41% 23.77% 24.49% 24.34%
Litigation settlement and
related costs, net ...... — 32.0 (32.0) — ———
% of net sales .......... — 0.31% — — —
Transaction and related
costs ............... — — —— 1.2 101.4 1.2
% of net sales .......... — — 0.02% 2.58% 0.01%
Operating profit ........ 953.3 580.5 372.8 64.2 246.1 9.2 330.6
% of net sales .......... 8.08% 5.55% 4.42% 0.24% 3.48%
Interest income ......... (0.1) (3.1) 2.9 (95.3) (3.8) (5.0) (8.8)
% of net sales .......... (0.00)% (0.03)% (0.07)% (0.13)% (0.09)%
Interest expense ........ 345.7 391.9 (46.2) (11.8) 252.9 10.3 436.7
% of net sales .......... 2.93% 3.75% 4.54% 0.26% 4.60%
Other (income) expense . . . 55.5 (2.8) 58.3 — 3.6 — 3.6
% of net sales .......... 0.47% (0.03)% 0.07% — 0.04%
Income (loss) before income
taxes ............... 552.1 194.4 357.7 184.0 (6.6) 4.0 (100.9)
% of net sales .......... 4.68% 1.86% (0.12)% 0.10% (1.06)%
Income taxes ........... 212.7 86.2 126.5 146.7 (1.8) 12.0 (42.9)
% of net sales .......... 1.80% 0.82% (0.03)% 0.31% (0.45)%
Net income (loss) ....... $ 339.4 $ 108.2 $ 231.3 213.8% $ (4.8) $ (8.0) $ (57.9)
% of net sales .......... 2.88% 1.03% (0.09)% (0.20)% (0.61)%
Diluted earnings per share . $ 1.04 $ 0.34 $ 0.70 205.9% $ (0.02)
(a) Includes the results of operations of BAC for the period prior to its merger with and into Dollar General
Corporation from March 6, 2007 (the date of BAC’s formation) through July 6, 2007 (reflecting the change in
fair value of interest rate swaps), and the post-merger results of Dollar General Corporation for the period
from July 7, 2007 through February 1, 2008.
(b) Includes the pre-merger results of Dollar General Corporation for the period from February 3, 2007 through
July 6, 2007.
33