Dollar General 2009 Annual Report Download - page 46
Download and view the complete annual report
Please find page 46 of the 2009 Dollar General annual report below. You can navigate through the pages in the report by either clicking on the pages listed below, or by using the keyword search tool below to find specific information within the annual report.-
 1
1 -
2
-
3
-
4
-
5
-
6
-
7
-
8
-
9
-
10
-
11
-
12
-
13
-
14
-
15
-
16
-
17
-
18
-
19
-
20
-
21
-
22
-
23
-
24
-
25
-
26
-
27
-
28
-
29
-
30
-
31
-
32
-
33
-
34
-
35
-
 36
36 -
 37
37 -
 38
38 -
 39
39 -
 40
40 -
 41
41 -
 42
42 -
 43
43 -
 44
44 -
 45
45 -
 46
46 -
 47
47 -
 48
48 -
 49
49 -
 50
50 -
 51
51 -
 52
52 -
 53
53 -
 54
54 -
 55
55 -
 56
56 -
57
-
58
-
59
-
60
-
61
-
62
-
63
-
64
-
65
-
66
-
67
-
68
-
69
-
70
-
71
-
72
-
73
-
74
-
75
-
76
-
77
-
78
-
79
-
80
-
81
-
82
-
83
-
84
-
85
-
86
-
87
-
88
-
89
-
90
-
91
-
92
-
93
-
94
-
95
-
96
-
97
-
98
-
99
-
100
-
101
-
102
-
103
-
104
-
105
-
106
-
107
-
108
-
109
-
110
-
111
-
112
-
113
-
114
-
115
-
116
-
117
-
118
-
119
-
120
-
121
-
122
-
123
-
124
-
125
-
126
-
127
-
128
-
129
-
130
-
131
 |
 |
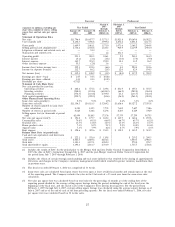
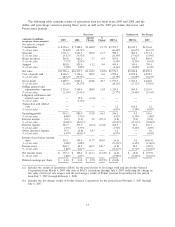
The gross profit rate as a percentage of sales was 29.3% in 2008 compared to 28.2% in the 2007
Successor period, 27.3% in the 2007 Predecessor period, and 27.8% for pro forma 2007. Factors
contributing to the increase in the 2008 gross profit rate include a lower inventory shrink rate; lower
promotional markdowns; improved leverage on distribution and transportation costs; and improved
markups related to changes resulting from the outcome of pricing analysis, our ability to react more
quickly to product cost changes and diligent vendor negotiations. In January 2009, we marked down
merchandise as the result of a late 2008 change in the interpretation of the phthalates provision of the
Consumer Product Safety Improvement Act of 2008 resulting in a charge of $8.6 million. Also in 2008,
we faced increased commodity cost pressures mainly related to food and pet products which were
driven by rising fruit and vegetable prices and freight costs. Increases in petroleum, resin, metals, pulp
and other raw material commodity driven costs also resulted in multiple product cost increases. Related
to these commodity cost increases, we recorded a LIFO expense of $43.9 million in 2008, compared to
the LIFO provision recorded in the 2007 Successor period of $6.1 million.
Selling, General and Administrative (‘‘SG&A’’) Expense. SG&A, as a percentage of sales, was
23.2% in 2009 compared to 23.4% in 2008, representing an improvement of 21 basis points. SG&A in
the 2009 period included expenses related to the completion of our initial public offering totaling
$68.3 million, or 58 basis points, including $58.8 million relating to the termination of an advisory
agreement among us, KKR and Goldman, Sachs & Co. and $9.4 million resulting from the acceleration
of certain equity based compensation. Our increased sales levels favorably impacted SG&A, as a
percentage of sales, with the most significant impact on store occupancy costs, including rent and
utilities. Our cost of utilities, as a percentage of sales, was further reduced by energy savings resulting
from our store energy management initiatives, including forward purchase contracts, increased
preventive maintenance and the installation of energy management systems in substantially all of our
new and relocated stores. In addition, we continued to significantly reduce our workers’ compensation
expense through safety initiatives implemented over the last several years, and legal expenses were
lower in 2009 than 2008, which included expenses incurred in connection with a shareholder litigation
settlement in 2008 relating to our 2007 merger.
SG&A expense as a percentage of sales decreased to 23.4% in 2008, compared to 23.8% and
24.5% in the 2007 Successor and Predecessor periods, respectively. The more significant items resulting
in the decrease in 2008 compared to the 2007 periods include: approximately $9.0 million and
$45.0 million in the 2007 Successor and Predecessor periods, respectively (including $2.4 million and
$4.1 million, respectively, also included in advertising costs discussed below) related to the closing of
stores and changes in our inventory strategy; a $12.0 million loss in the 2007 Successor period
compared to a $5.0 million gain in 2008 relating to potential losses on distribution center leases;
advertising costs of $27.8 million in 2008 compared to $23.6 million and $17.3 million in the 2007
Successor and Predecessor periods, respectively; and decreases in workers compensation and other
insurance-related costs compared to the 2007 periods. These decreases were partially offset by an
increase in incentive compensation and related payroll taxes in 2008 compared to the 2007 periods due
to improved overall financial performance, increased amortization of leasehold intangibles capitalized in
connection with the revaluation of assets at the date of our 2007 merger, and an increase in
professional fees in 2008 compared to the 2007 periods primarily reflecting legal expenses related to
shareholder litigation.
SG&A decreased to 23.4% in 2008 compared to 24.3% in pro forma 2007. The more significant
items resulting in the decrease from the 2007 pro forma results include: $54.0 million of costs in pro
forma 2007 SG&A relating to the closing of stores and the implementation of new inventory strategies;
a $12.0 million loss in the 2007 pro forma period compared to a $5.0 million gain in 2008 relating to
possible losses on distribution center leases; and decreases in workers compensation and other
insurance-related costs in 2008 of $10.4 million compared to the 2007 pro forma period. These
decreases were partially offset by an increase in incentive compensation and related payroll taxes of
35