Dollar General 2009 Annual Report Download - page 45
Download and view the complete annual report
Please find page 45 of the 2009 Dollar General annual report below. You can navigate through the pages in the report by either clicking on the pages listed below, or by using the keyword search tool below to find specific information within the annual report.-
 1
1 -
2
-
3
-
4
-
5
-
6
-
7
-
8
-
9
-
10
-
11
-
12
-
13
-
14
-
15
-
16
-
17
-
18
-
19
-
20
-
21
-
22
-
23
-
24
-
25
-
26
-
27
-
28
-
29
-
30
-
31
-
32
-
33
-
34
-
 35
35 -
 36
36 -
 37
37 -
 38
38 -
 39
39 -
 40
40 -
 41
41 -
 42
42 -
 43
43 -
 44
44 -
 45
45 -
 46
46 -
 47
47 -
 48
48 -
 49
49 -
 50
50 -
 51
51 -
 52
52 -
 53
53 -
 54
54 -
 55
55 -
56
-
57
-
58
-
59
-
60
-
61
-
62
-
63
-
64
-
65
-
66
-
67
-
68
-
69
-
70
-
71
-
72
-
73
-
74
-
75
-
76
-
77
-
78
-
79
-
80
-
81
-
82
-
83
-
84
-
85
-
86
-
87
-
88
-
89
-
90
-
91
-
92
-
93
-
94
-
95
-
96
-
97
-
98
-
99
-
100
-
101
-
102
-
103
-
104
-
105
-
106
-
107
-
108
-
109
-
110
-
111
-
112
-
113
-
114
-
115
-
116
-
117
-
118
-
119
-
120
-
121
-
122
-
123
-
124
-
125
-
126
-
127
-
128
-
129
-
130
-
131
 |
 |
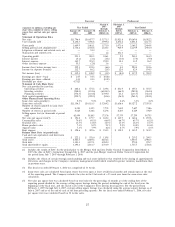
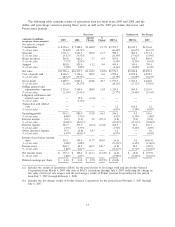
The following discussion of our financial performance also includes supplemental unaudited pro
forma condensed consolidated financial information for 2007. Because the 2007 merger occurred during
our 2007 second quarter, we believe this information aids in the comparison between the years
presented. The pro forma information does not purport to represent what our results of operations
would have been had the 2007 merger and related transactions actually occurred at the beginning of
the year indicated, and they do not purport to project our results of operations or financial condition
for any future period. See ‘‘Unaudited Pro Forma Condensed Consolidated Financial Information’’
below.
Net Sales. The net sales increase in 2009 reflects a same-store sales increase of 9.5% compared to
2008. Same-stores include stores that have been open for 13 months and remain open at the end of the
reporting period. For 2009, there were 8,324 same-stores which accounted for sales of $11.36 billion.
The remainder of the increase in sales in 2009 was attributable to new stores, partially offset by sales
from closed stores. The strong increase in sales reflects the results of our various initiatives
implemented throughout 2008 and 2009, including the impact of improved store standards, the
expansion of our merchandise offerings, including significant enhancements to our convenience food
and beverages and health and beauty products, in addition to improved utilization of square footage,
extended store hours and improved marketing efforts. In 2009, we continued the transformation of our
private brand products as further discussed above in the Executive Overview.
The net sales increase in 2008 reflects a same-store sales increase of 9.0% compared to 2007. For
2008, there were 8,153 same-stores which accounted for sales of $10.12 billion. There were no purchase
accounting or other adjustments to net sales as a result of our 2007 merger, therefore, the 2007 net
sales and other amounts presented related to 2007 net sales are calculated using the 2007 52-week
fiscal year. The remainder of the increase in sales in 2008 was attributable to new stores, partially offset
by sales from closed stores. The increase in sales of consumables reflects the various initiatives
implemented in 2008, including the impact of improved store standards, the expansion of convenience
food and beverage offerings, improved utilization of square footage and extended store hours. The
majority of our merchandising efforts in 2008 related to the consumables category, including planogram
resets and increased emphasis on private brand products.
Of our four major merchandise categories, the consumables category has grown most significantly
over the past several years. Although this category generally has a lower gross profit rate than the other
three categories, as discussed below, we were able to increase our overall gross profit rate in both 2009
and 2008. Because of the impact of sales mix on gross profit, we continually review our merchandise
mix and strive to adjust it when appropriate. Maintaining an appropriate sales mix is an integral part of
achieving our gross profit and sales goals. Both the number of customer transactions and average
transaction amount increased in 2009 and 2008, and we believe that our stores have benefited to some
degree from attracting new customers who are seeking value as a result of the current economic
environment.
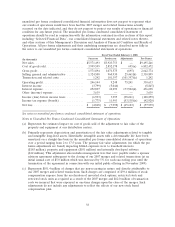
Gross Profit. The gross profit rate as a percentage of sales was 31.3% in 2009 compared to 29.3%
in 2008. Factors contributing to the increase in the 2009 gross profit rate include increased markups
resulting primarily from higher purchase markups, partially offset by increased markdowns. In addition,
our increased sales volumes have contributed to our ability to reduce purchase costs from our vendors.
Transportation and distribution costs decreased for the year driven by lower fuel costs as well as the
impact of cost reduction initiatives. Higher sales volumes and productivity initiatives also contributed to
improved leverage of our distribution costs. In addition, inventory shrinkage as a percentage of sales
declined in 2009 from 2008, contributing to our gross profit rate improvement. Finally, in 2009, we
recorded a LIFO benefit of $2.5 million, reflecting a flattening of merchandise costs in 2009 further
described below, compared to a LIFO provision of $43.9 million in 2008.
34