Dollar General 2009 Annual Report Download - page 49
Download and view the complete annual report
Please find page 49 of the 2009 Dollar General annual report below. You can navigate through the pages in the report by either clicking on the pages listed below, or by using the keyword search tool below to find specific information within the annual report.-
 1
1 -
2
-
3
-
4
-
5
-
6
-
7
-
8
-
9
-
10
-
11
-
12
-
13
-
14
-
15
-
16
-
17
-
18
-
19
-
20
-
21
-
22
-
23
-
24
-
25
-
26
-
27
-
28
-
29
-
30
-
31
-
32
-
33
-
34
-
35
-
36
-
37
-
38
-
 39
39 -
 40
40 -
 41
41 -
 42
42 -
 43
43 -
 44
44 -
 45
45 -
 46
46 -
 47
47 -
 48
48 -
 49
49 -
 50
50 -
 51
51 -
 52
52 -
 53
53 -
 54
54 -
 55
55 -
 56
56 -
 57
57 -
 58
58 -
 59
59 -
60
-
61
-
62
-
63
-
64
-
65
-
66
-
67
-
68
-
69
-
70
-
71
-
72
-
73
-
74
-
75
-
76
-
77
-
78
-
79
-
80
-
81
-
82
-
83
-
84
-
85
-
86
-
87
-
88
-
89
-
90
-
91
-
92
-
93
-
94
-
95
-
96
-
97
-
98
-
99
-
100
-
101
-
102
-
103
-
104
-
105
-
106
-
107
-
108
-
109
-
110
-
111
-
112
-
113
-
114
-
115
-
116
-
117
-
118
-
119
-
120
-
121
-
122
-
123
-
124
-
125
-
126
-
127
-
128
-
129
-
130
-
131
 |
 |

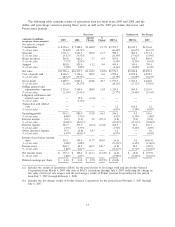
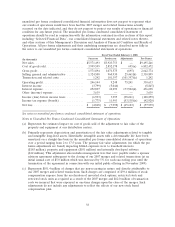
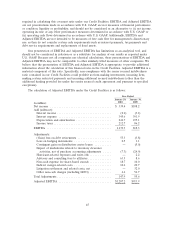
unaudited pro forma condensed consolidated financial information does not purport to represent what
our results of operations would have been had the 2007 merger and related transactions actually
occurred on the date indicated, and they do not purport to project our results of operations or financial
condition for any future period. The unaudited pro forma condensed consolidated statement of
operations should be read in conjunction with the information contained in other sections of this report
including ‘‘Selected Financial Data’’, our consolidated financial statements and related notes thereto,
and other sections of this Management’s Discussion and Analysis of Financial Condition and Results of
Operations. All pro forma adjustments and their underlying assumptions are described more fully in
the notes to our unaudited pro forma condensed consolidated statements of operations.
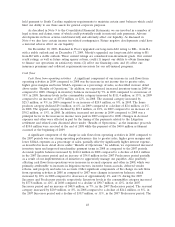
Fiscal Year Ended February 1, 2008
Successor Predecessor Adjustments Pro Forma
(In thousands)
Net sales ............................. $5,571,493 $3,923,753 $ — $9,495,246
Cost of goods sold ...................... 3,999,599 2,852,178 695(a) 6,852,472
Gross profit ........................... 1,571,894 1,071,575 (695) 2,642,774
Selling, general and administrative .......... 1,324,508 960,930 25,461(b) 2,310,899
Transaction and related costs .............. 1,242 101,397 (101,397)(c) 1,242
Operating profit ........................ 246,144 9,248 75,241 330,633
Interest income ........................ (3,799) (5,046) — (8,845)
Interest expense ........................ 252,897 10,299 173,502(d) 436,698
Other (income) expense .................. 3,639 — — 3,639
Income (loss) before income taxes .......... (6,593) 3,995 (98,261) (100,859)
Income tax expense (benefit) .............. (1,775) 11,993 (53,138)(e) (42,920)
Net loss ............................. $ (4,818) $ (7,998) $ (45,123) $ (57,939)
See notes to unaudited pro forma condensed consolidated statement of operations.
Notes to Unaudited Pro Forma Condensed Consolidated Statement of Operations
(a) Represents the estimated impact on cost of goods sold of the adjustment to fair value of the
property and equipment at our distribution centers.
(b) Primarily represents depreciation and amortization of the fair value adjustments related to tangible
and intangible long-lived assets. Identifiable intangible assets with a determinable life have been
amortized on a straight-line basis in the unaudited pro forma consolidated statement of operations
over a period ranging from 2 to 17.5 years. The primary fair value adjustments (on which the pro
forma adjustments are based) impacting SG&A expenses were to leasehold interests
($185 million), property and equipment ($101 million) and internally developed software
($12 million). This adjustment also includes management fees that were payable under a sponsor
advisory agreement subsequent to the closing of our 2007 merger and related transactions (at an
initial annual rate of $5.0 million which was increased by 5% for each succeeding year until the
termination of the agreement in connection with our initial public offering in November 2009).
(c) Represents $101.4 million of charges that are non-recurring in nature and directly attributable to
our 2007 merger and related transactions. Such charges are comprised of $39.4 million of stock
compensation expense from the acceleration of unvested stock options, restricted stock and
restricted stock units as required as a result of the 2007 merger and $62.0 million of transaction
costs we incurred that were expensed as one-time charges upon the close of the merger. Such
adjustments do not include any adjustments to reflect the effects of our new stock based
compensation plan.
38